


2020.10.11 Weekly Market Update

October 11, 2020
The North American stock markets are bullish and new all-time highs are likely.
Grains are advancing and the Golden Age of Agriculture is around the corner.
Bitcoin is under attack with the US attempting to regulate the unregulated exchanges.
It is unfortunate that they let JP Morgan, Goldman Sachs and Wells Fargo commit crimes with little repercussions.
I recently began an Introduction to Trading and Investing Workshop that will provide you with the tools and confidence to take control of your investments.
I believe that this workshop will be of great benefit to both new traders and veteran investors. You can sign up on my website with this link: Trading and Investing Workshop.
If no dates are available, reach out to me.
Our free Telegram group, Klarenbach Research, is growing in numbers, and the members are getting more comfortable with asking questions regarding traditional markets and Bitcoin.
We post entries, stops and exits in order that members can learn how to identify low-risk high probability trades.
Some of our members are catching on really quickly and are experiencing success in their trading accounts.
This is where the majority of the ideas are posted.
This is the link https://t.me/klarenbachresearch.
I hope you check it out.
We have had success with our Trade Ideas and the ideas posted on our Telegram Group.
I have included the Trade Results Summary.

The number of trades is becoming too lengthy for this publication.
The expectancy of the Telegram Group trades is 4.39% for a 17-day hold.
Extrapolated out to a 30-day month and the result is a 7.75% monthly gain.
I adopted components of Van Tharp’s System Evaluation, which I believe is more effective for system evaluation than win rates.
MARKET REVIEW
**Click on any chart to enlarge**
SPDR S&P 500 ETF TRUST (SPY)
This market is strong and is back above the swing high golden pocket. The price pattern looks like a wedge or a bear flag. We also have a .786 fib level overhead as well as a trendline.
The price is above a rising 50 DMA and remains bullish.
INVESCO QQQ TRUST NASDAQ 100 ETF (QQQ)
We also identified this rising wedge or bear flag with the price approaching the .618 Fibonacci retracement level.
The price closed the week above the 50 DMA and overall this is bullish.
SPDR DOW JONES INDUSTRIAL AVERAGE ETF (DIA)

The DIA is forming a rising wedge above the 50 DMA. Last week high was at the .786 fib level. This is overall bullish, however, one should be aware of the bearish pattern and the 0.786 fib level.
ISHARES TRUST RUSSELL 2000 ETF (IWM)

The Russell 2K is showing relative strength against the other indices. The gap looks like it has been filled and perhaps we will have a new ATH this week.
TSX Composite Index (TSX)

The TSX is back above the 50 DMA and if you look closely, you can see that it is starting to advance. This bullish.
S&P 500 Volatility Index (VIX)

Keep an eye on the VIX.
Last week, the VIX tested the 200 DMA before closely below the 50 DMA.
I am paying close attention to the trendlines that I have drawn on the chart.
West Texas Oil (WTIC)

The price is back above the declining 200 DMA and closed beneath the flattening 50 DMA. I expected that WTI to go lower to test the light blue VWAP from the April low near 33.00, however, oil rose 10+% last week.
GOLD Spot (XAUUSD)
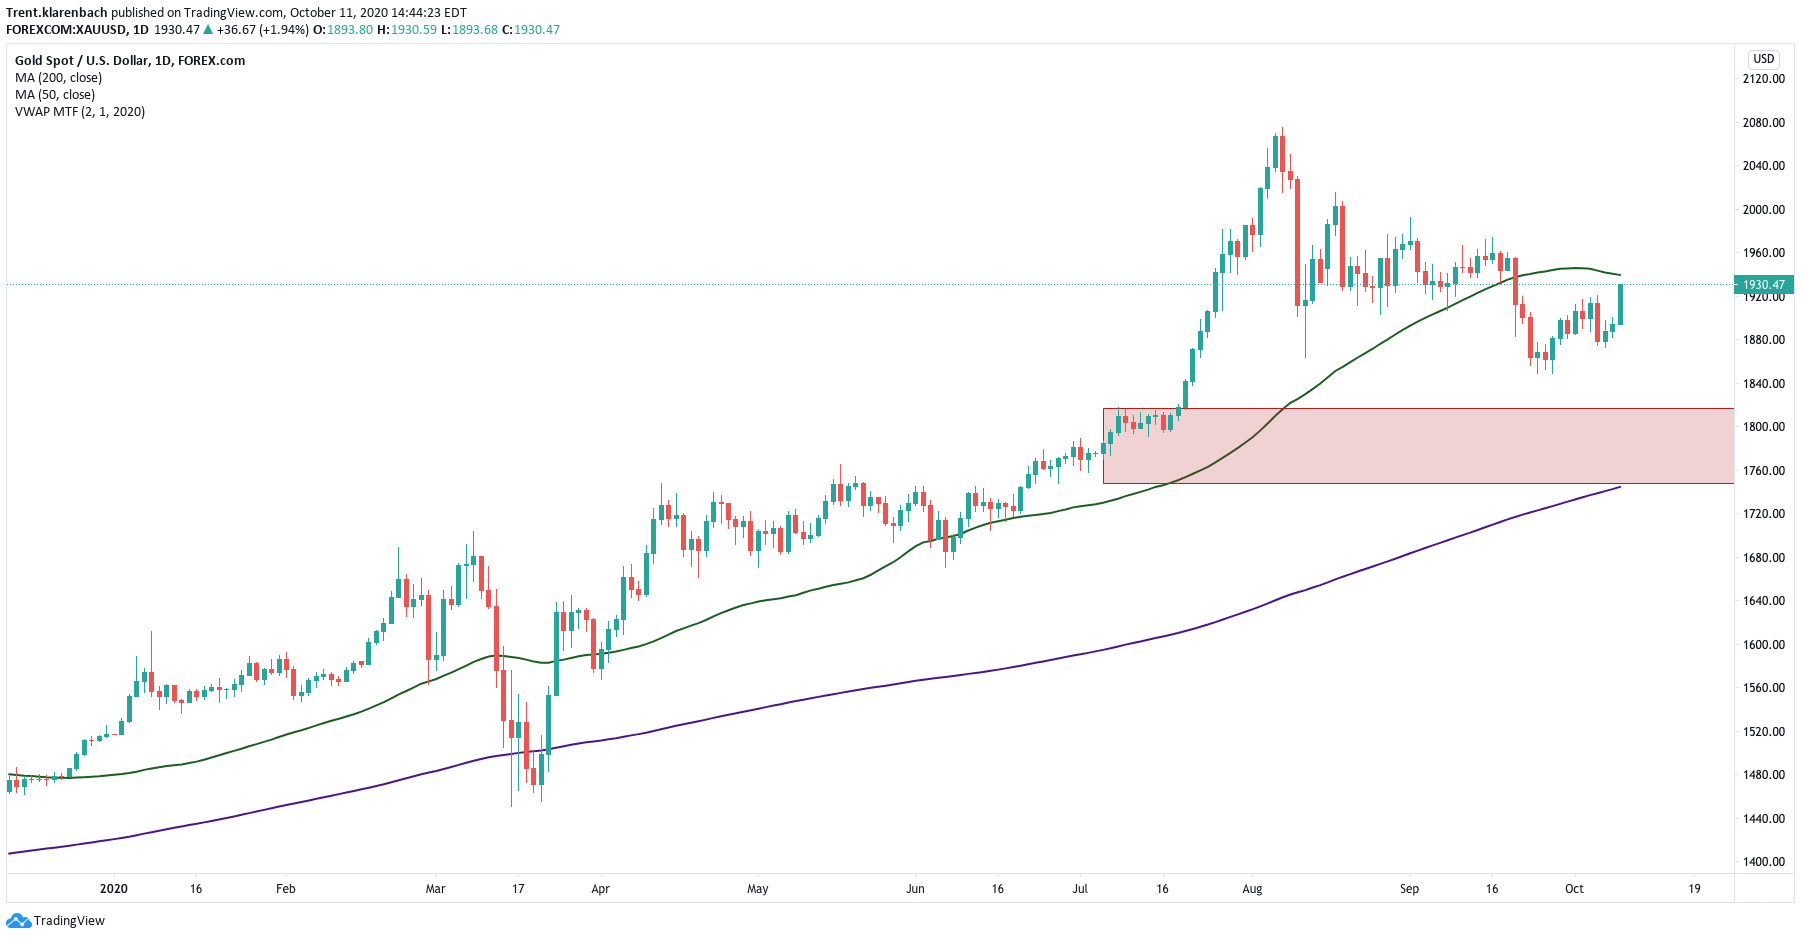
The price is retesting the bottom of the triangle which is the expected price action. The declining 50 DMA overhead is expected to act as resistance.
I anticipate the price to drop to the red triangle in the 17.50 to 1820 range and then we will reassess.
US Dollar / Canadian Dollar (USDCAD)
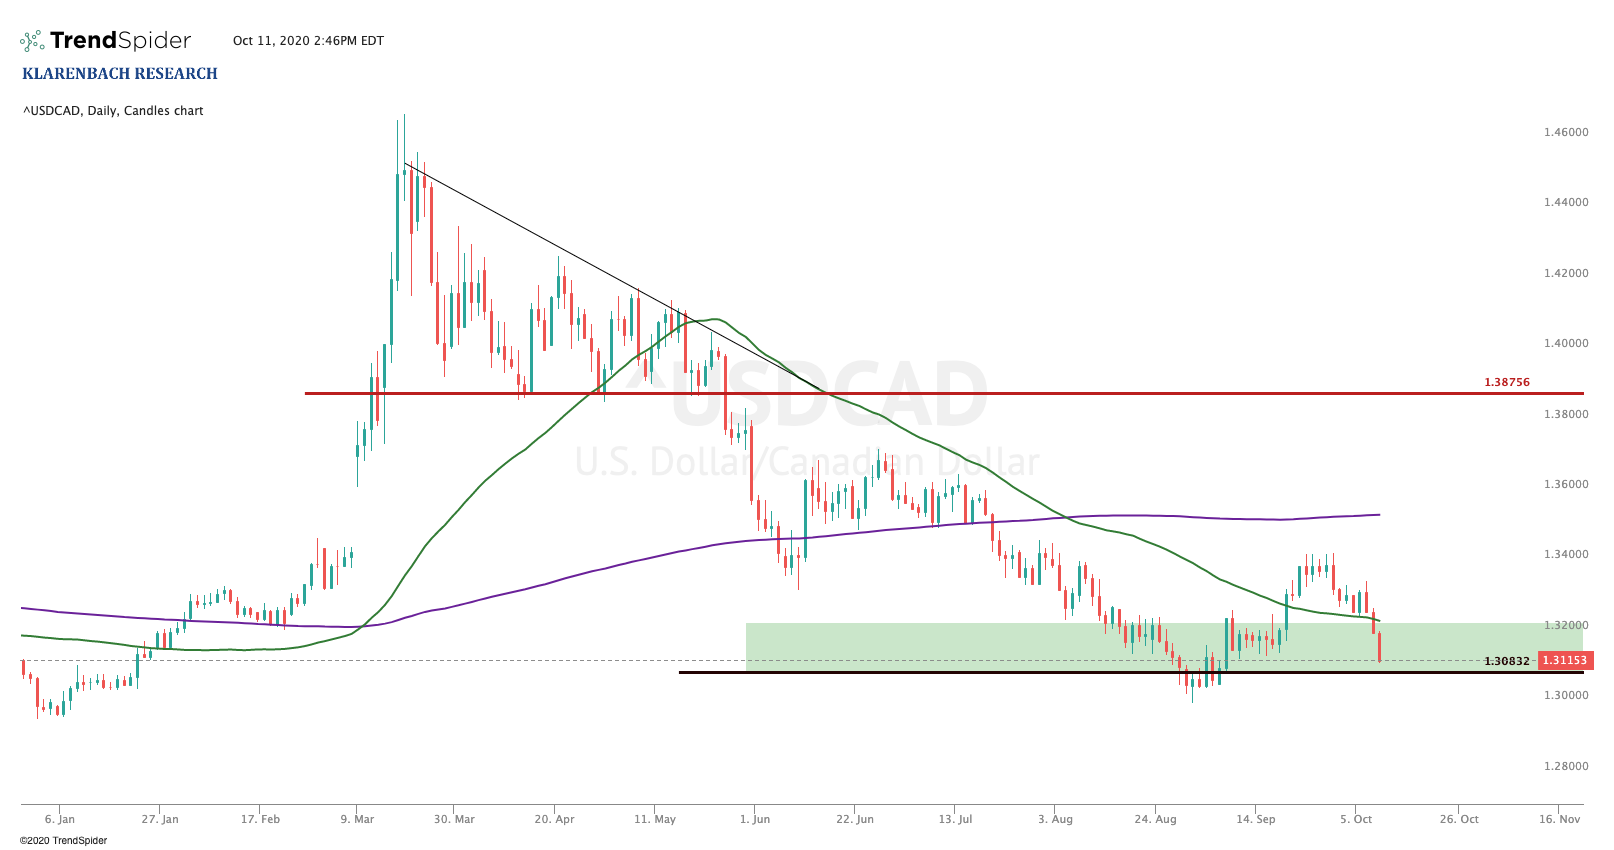
I am testing out Trendspider again and pulled up this chart. You might remember seeing this green target area in the June 7 newsletter.
The USDCAD appears as it could be over.
US Dollar Currency Index (DXY)

As we have anticipated, the DXY has tested the yellow trendline. The price is also below the declining 200 Week Moving Average.
This is a bearish chart.
BITCOIN (BTC)

BTC seems to be moving in correlation to the S&P 500 again and is back above the rising 30-, 40-, 50- and 200 Week Moving Averages
This is my Hyperwave chart. I won’t get into all the Hyperwave rules, however, it is a fascinating concept.
I adjusted my Phase 7 line to account for the new recent price action.
Hyperwave patterns occur across all asset classes. Basically, the rules state that unless the Phase 7 line is broken, you can expect prices to retrace to the Phase 1 line. In my chart, that would mean sub $1000 BTC.
Do I think that will happen? No, I am bullish BTC.
Do I think it can happen? Yes
Am I prepared it that happens? Yes
What would be the catalyst? My guess is a worldwide depression and a stock market crash with a flight to USD. Following last week’s Bitmex drama involving the US attempting to regulate the unregulated exchanges could be a catalyst also.
John McAffee even got arrested so shit is getting real.
WHEAT FUTURES (ZW1!)

The wheat price closed the week above the upper trend line of my ascending triangle making a new 5 year high. My price target is still in effect. We have been watching for this breakout since April.
SOYBEAN FUTURES (ZS1!)

SOY closed the week just shy of a 3 year high.
SOY is extended. I would not be surprised if the price retraces to test the yellow trend line from 2012 and allowing the moving averages to catch up.
This chart could be predicting a boom in the vegetarian food market.
This market, in particular, veggie burgers will be to farmers, what the internal combustion engine was to the early oil producers.
CANOLA NOV ’20 FUTURES (RSX20)

Price is testing the area of previous resistance which I expect to break. The price extended and I expect it to first retrace, maybe test the breakout trend line from 2008 before moving much, much higher. This is bullish. Very Bullish.
The red line market the price level where the Townies introduce arranged marriages to Saskatchewan farmers.
“If the women don’t find you handsome, they should at least know you have bins full of Canola.” - unknown patron in a small-town Saskatchewan bar
TLT vs SPY RATIO
(ISHARES 20+ YEAR TREASURY BOND ETF vs SPDR S&P 500 ETF TRUST)

The TT/SPY ratio is about to make a new low.
Keep an eye on this ratio, as it has recently broken out above the trendline from the high. This ratio can be forecast a change in direction and/or movement in the S&P 500.
SPDR S&P 500 ETF TRUST (SPY)
US DOLLAR CURRENCY INDEX (DXY)
ISHARES 20+ YEAR TREASURY BOND ETF (TLT)
ISHARES TRUST IBOXX USD HIGH YIELD CORPORATE BOND ETF (HYG)
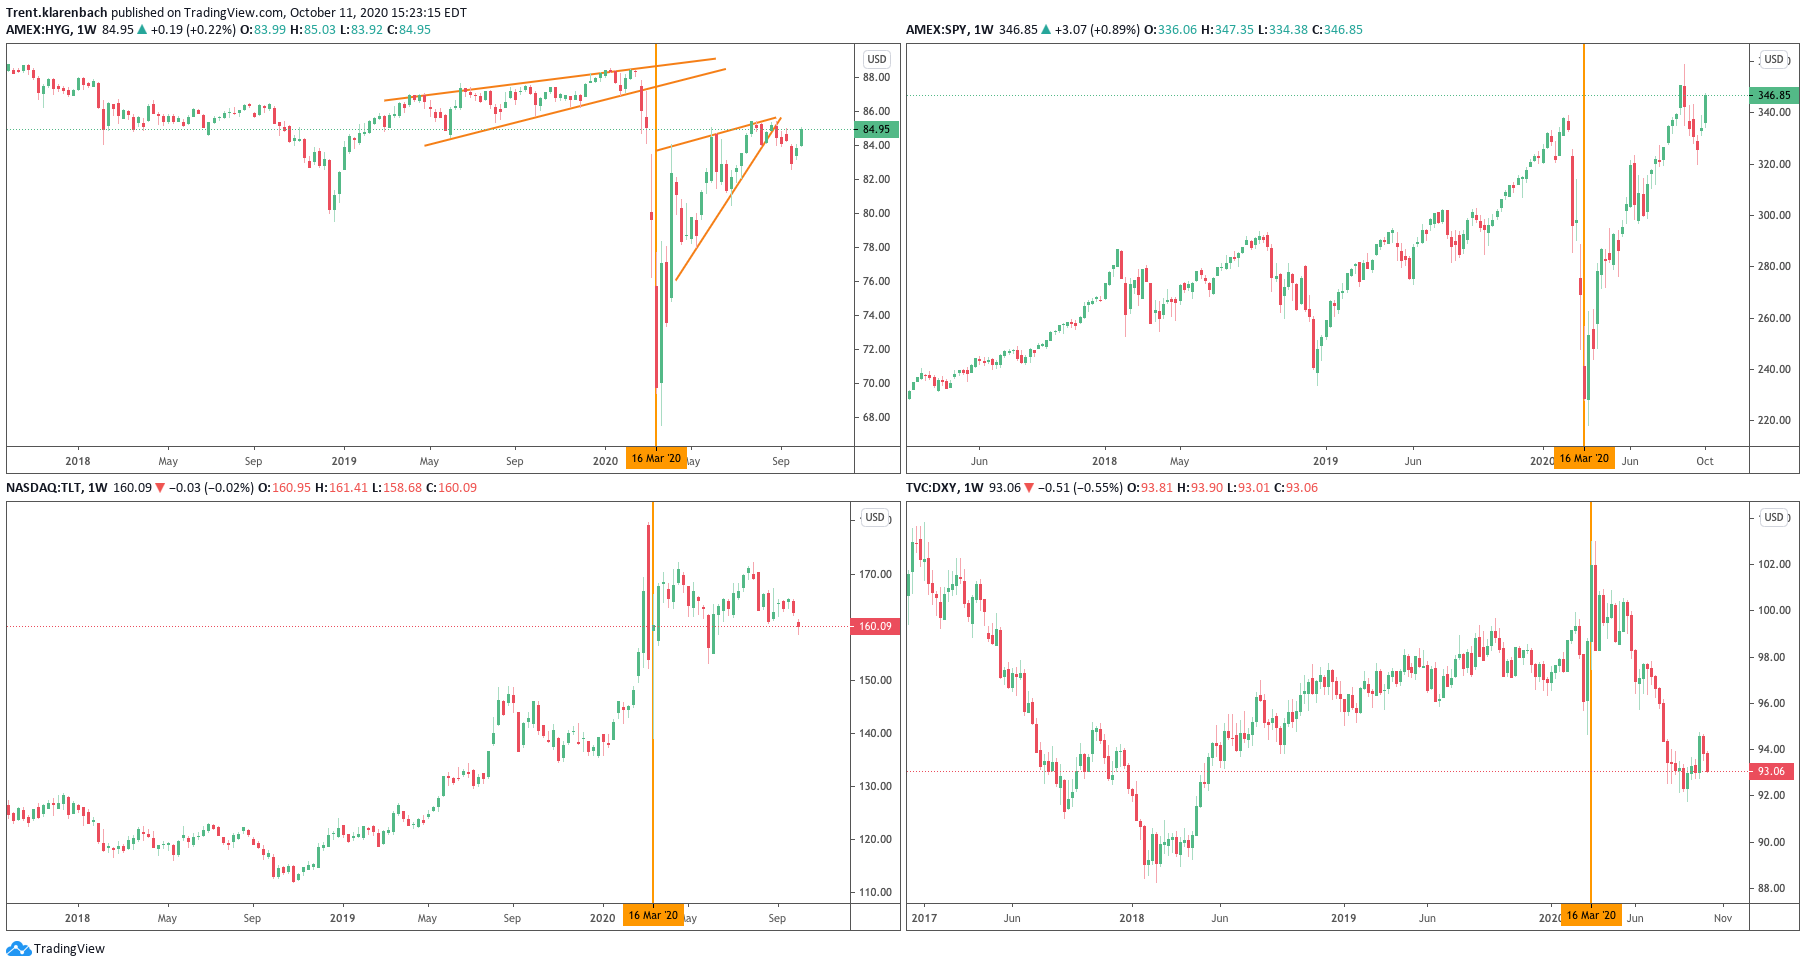
I like comparing the price action of these four charts consisting of the S&P 500, 20+Year Treasury Bonds, the USD and High Yield Corporate Bonds.
These charts look bullish for the S&P 500.
HYG can act as an early warning for a drop in the S&P 500, a rise in the USD and a drop in 20+ year treasuries.
BITCOIN CME FUTURES (BTC1!)
US DOLLAR CURRENCY INDEX (DXY)
SILVER FUTURES COMEX (SI1!)
GOLD FUTURES COMEX (GC1!)

I find how the “safe havens” move in relation to the USD fascinating. These charts are valuable in demonstrating something that we probably already “knew”.
If the USD continues to the downside, then I expect the safe havens to rise.
FACEBOOK (FB: NASDAQ)

FB closed below its 50 DMA, however, I expect the price to regain the 50 DMA this week.
AMAZON (AMZN: NASDAQ)

AMZN closed the week at the Swing high/low 0.618 fib level. The price is above the 50 DMA which is bullish.
APPLE (AAPL: NASDAQ)

AAPL closed above the 50 DMA at the 0.382 fib level, however, it could be forming a bear flag.
MICROSOFT (MFST: NASDAQ)
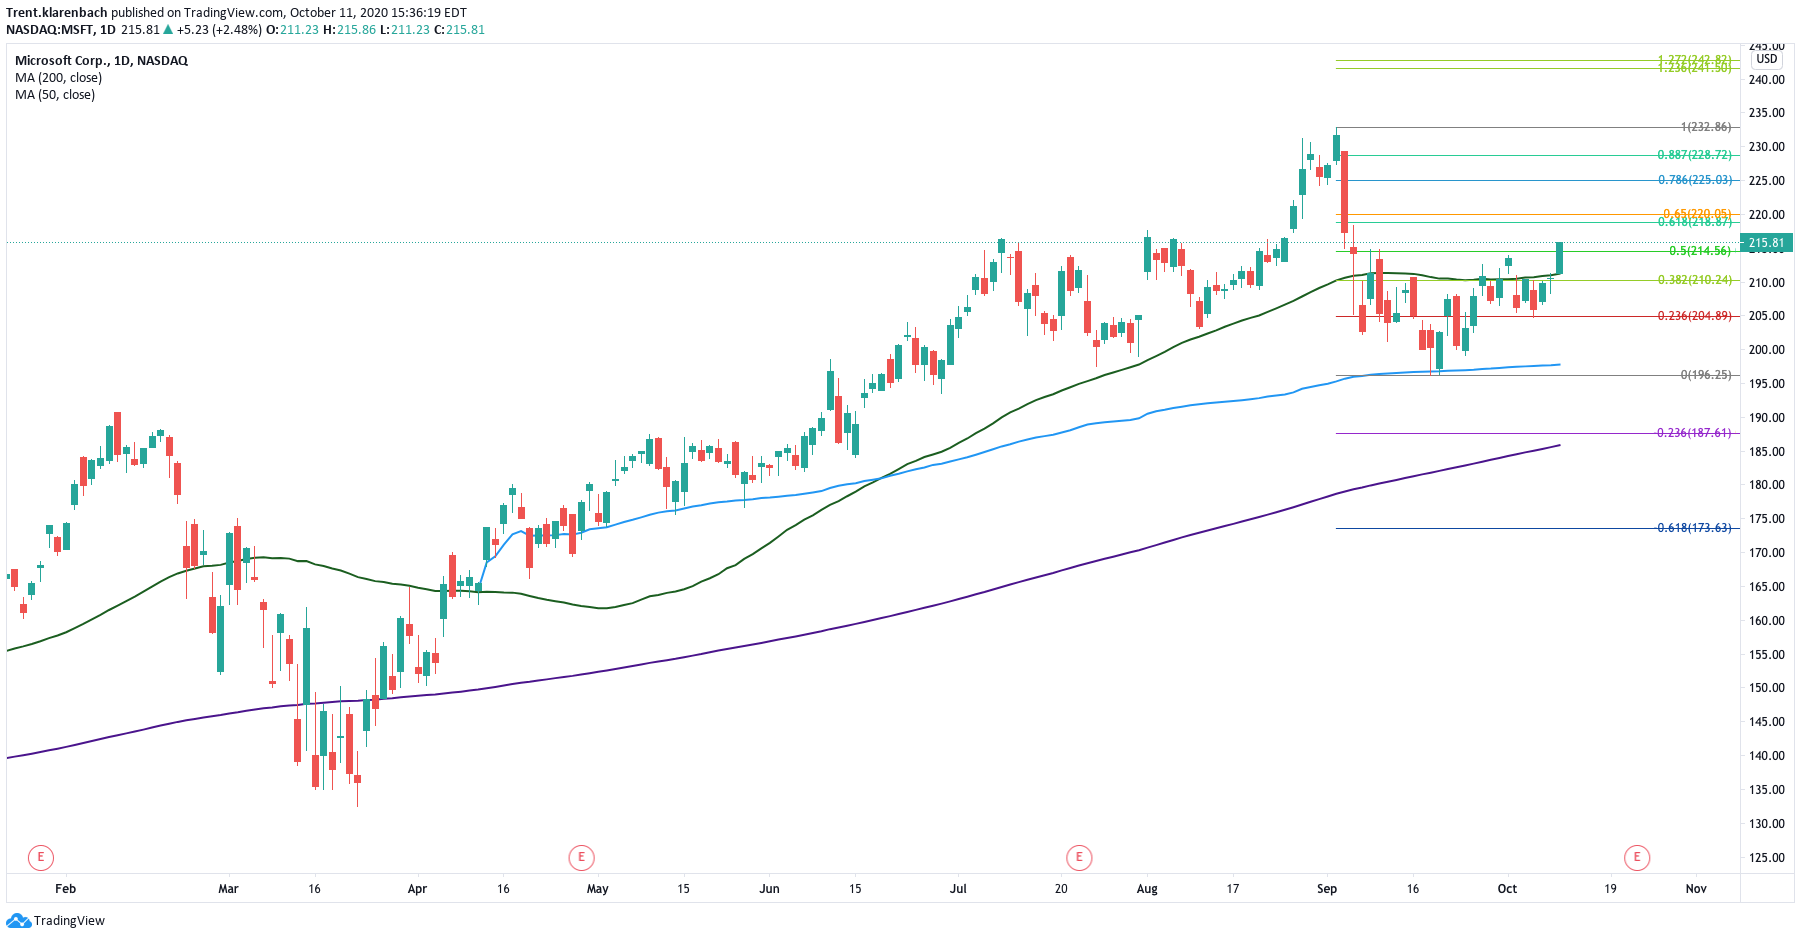
The price is back above the 50 DMA which is bullish. I see a potential head-and-shoulders pattern forming on this Daily chart. If this forms, then I expect the price to test the 200 DMA in the 180-190 area. Look for price to slow down or find resistance or slow down at the .618-.65 Golden Pocket level of interest.
NETFLIX (NFLX: NASDAQ)

NFLX is back above the rising 50 DMA which is bullish.
ALPHABET (GOOG: NASDAQ)

GOOG could be forming a bear flag with the 50 DMA overhead. I also see a head-and-shoulders potentially forming.
FAANG STOCKS (FB+AAPL+AMZN+NEFLIX+GOOG)
I combined the FAANG stocks into one chart. As you can see, the price is above a rising 50 DMA. The Golden Pocket is just overhead.
These stocks have been driving the stock market for years now.
Do you see a head-and-shoulders pattern potentially forming?
If it completes, then I can see a 25% decline in this combination to the 200 DMA and YTD VWAP.
The direction that FAANG stocks go has been determining the direction of the broad market indices.
Will that continue? I do no know.
Should we be aware of that correlation? Yes.
INVESTOR CLASS IDEAS
With the uncertainty in the market, we don't have any Investor Class Ideas for this week.
I will post in the Telegram Channel as Trade Ideas develop and are identified during the week.
Here is the link: https://t.me/klarenbachresearch
REMEMBER, CASH IS A POSITION
Don’t FOMO into a position. Have a plan.
SWING TRADE IDEAS
Swing trades will be posted as they are identified in the Klarenbach Research Telegram Channel.
We have been active in the Telegram Channel with impressive results.
Here is the link: https://t.me/klarenbachresearch
Last week, we exited two trades for gains. Here they are:

Here are the Current Open Trades in our Telegram group.

That is all for now!
Drop me a line with any questions or comments. You can do that here.
I am actively posting charts and ideas on social media.
You can find me here:
Klarenbach Research: klarenbach.ca
Telegram: Klarenbach Research
Twitter: @trentklarenbach
StockTwits: trentklarenbach
Tradingview: trent.klarenbach
I hope you find the FREE Klarenbach Report worthy of your time and choose to hit the subscribe button below.
Please share with anyone else that you think may enjoy it also.
Remember... It is FREE!
Life is Good
This newsletter is sponsored by Mojocial Media
