


2020.12.06 CADUSD Futures Strategy


As there is interest in my analysis of the USDCAD and CADUSD pairs, I will begin reporting on strategies as I identify them.
Please share this report with someone that would benefit from this analysis.
If you are interested in a specific stock, commodity, FX, or cryptocurrency, please reach out to me via the contact information below.
For transparency, I will track my Forex trades on the CME Practice Simulator.
The CME uses the CADUSD pair and that is how my position will be executed.
The USDCAD trade would be the reverse of this example.
Here are our Current Open Positions reporting in the CME Practice Simulator.

I am currently up 100% on our position and will not turn this into a loser.
Let’s look at the CADUSD weekly chart.
*******Click on each chart to expand*******

As the above chart shows the price breaking out above the:
light blue VWAP (Volume-Weighted Average Price) from the September 2017 high;
purple VWAP from the JUN 2014 high; and,
my ‘best fit’ horizontal line of resistance.
I view each of these to be bullish CAD, bearish USD.
Below is the Daily chart.

The Daily chart has the price:
on a Daily Green TD 9
approaching the 1.618 Fibonacci level
Next week, I anticipate, the CADUSD retrace from last week’s high or maybe even get up to the 1.618 level before retracing.
If this happens, I am prepared for the price to retrace to the area of the breakout near the purple VWAP before continuing higher.
As I only have one contract in each of the December and March contracts, I plan to exit both positions locking in profits upon hitting the 1.618 level or the first sign of weakness.
This is dependant on how the week opens. If the week gaps up at the open then I will most likely stay long.
I am still bullish on the CADUSD pair and will re-enter long positions at my first indication the retracement is over.
Let’s take a look at the charts of our open trades.
CADUSD CANADIAN DOLLAR/US DOLLAR
6CZO DEC 2020

The DEC 2020 chart above shows our long entry at .76810 in green and our stop in red at 0.76325.
I placed my stop below the rising red 10 DMA and the VWAP from the Nov 9 High.
Last Friday’s candle is on a Green TD9 with a 1.618 Fibonacci level above it a .78470
I will be looking to taking profits at 0.78470 or upon weakness in today’s candle.
This is dependant on how the week opens. If the week gaps up at the open then I will most likely stay long.
Let’s look at the other position.
CADUSD CANADIAN DOLLAR/US DOLLAR
6CH1 MAR 2021
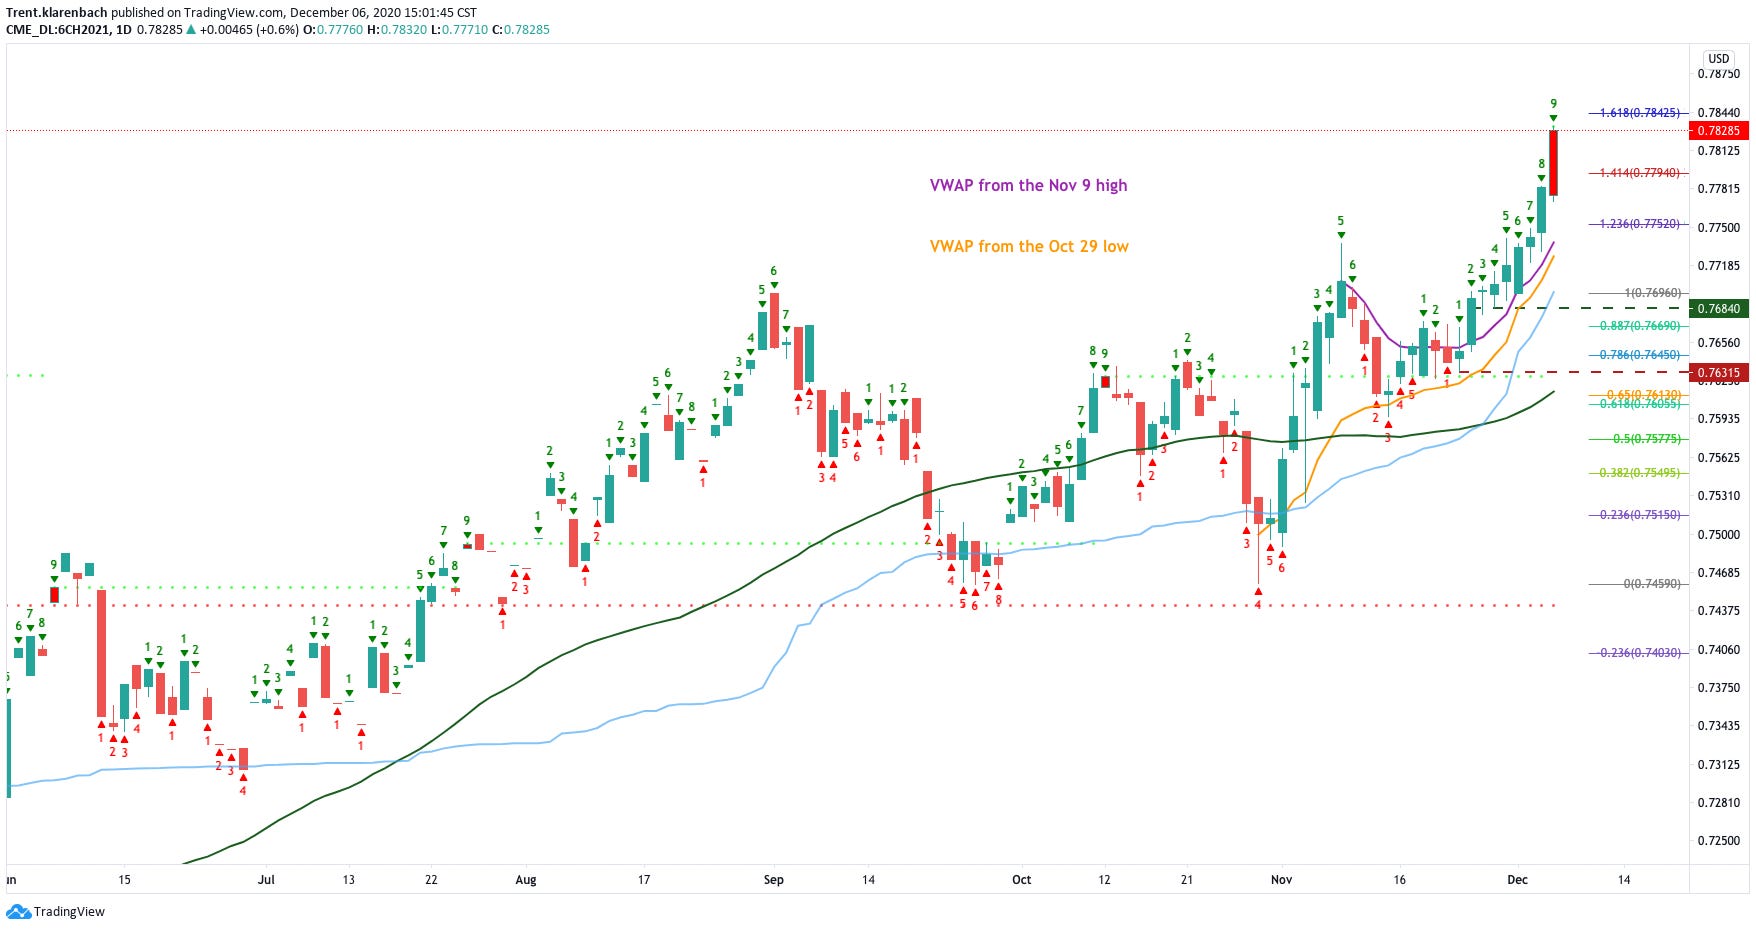
The MAR 2021 chart above depicts our Long entry at .76840 in green and our stop in red at 0.76315.
I placed my stop below the rising red 10 DMA and the VWAP from the Nov 9 High.
Friday’s candle on a green TD9 with a 1.618 Fibonacci level above at 0.78425.
I plan on taking profit at the 0.78425 level or at the first sign of weakness on tonight’s candle.
This is dependant on how the week opens. If the week gaps up at the open then I will most likely stay long.
Life is Good.
If you enjoy this newsletter please subscribe below:
Please share the Klarenbach Report with those who would benefit from this resource.
Drop me a line with any questions or comments. You can do that here
I am actively posting charts and ideas on social media.
You can find me here:
Klarenbach Research: klarenbach.ca
Twitter: @trentklarenbach
StockTwits: trentklarenbach
Telegram Channel: Klarenbach Research
Tradingview: trent.klarenbach
The Klarenbach Report is sponsored by Mojocial Media.
