


2022.06.06 Market Overview
Trade Ideas for the Active Investor

There is a lot of talk of a recession this year, a recession next year, a recession in 2024 and even arguments are made that we are already in one.
Today, I look at some charts to gauge relative performance and prepare one for future price action.
DIA - SPDR DOW JONES INDUSTRIAL AVERAGE ETF

New lows below the the declining weekly Moving Averages signal a downtrend has begun.
Buyers stepped at the purple Volume-Weighted Average (VWAP) anchored from the 2020 low.
The VWAP indicates the average price paid per share since the 2020 low. If the price is above the VWAP, the average share purchased since then is profitable.
Why is this important?
Is a profitable investor likely to sell their position or add to it?
If you are in a losing position, are you likely to add or sell?
If this purple VWAP fails to hold, we can anticipate an accelerated move lower.
This holds true for the following charts.
SPY - SPDR S&P 500 ETF

The SPY weekly chart looks bearish with the longer-term Moving Averages crossing over signalling a trend change.
Buyers stepped at the purple VWAP and the 38.2% retracement from the 2020 low.
How the price reacts to this overhead supply is critical.
QQQ - Invesco QQQ Trust (NDX100)

Similar to the SPY, but weaker, the declining moving averages signal a downtrend.
Note how quickly the price declined following the break of the yellow channel.
Buyers stepped in at the confluence of the purple VWAP from the 2019 low and the 50% retracement.
The purple VWAP is an essential level for the NDX 100.
IWM - Ishares Russell 2000 ETF
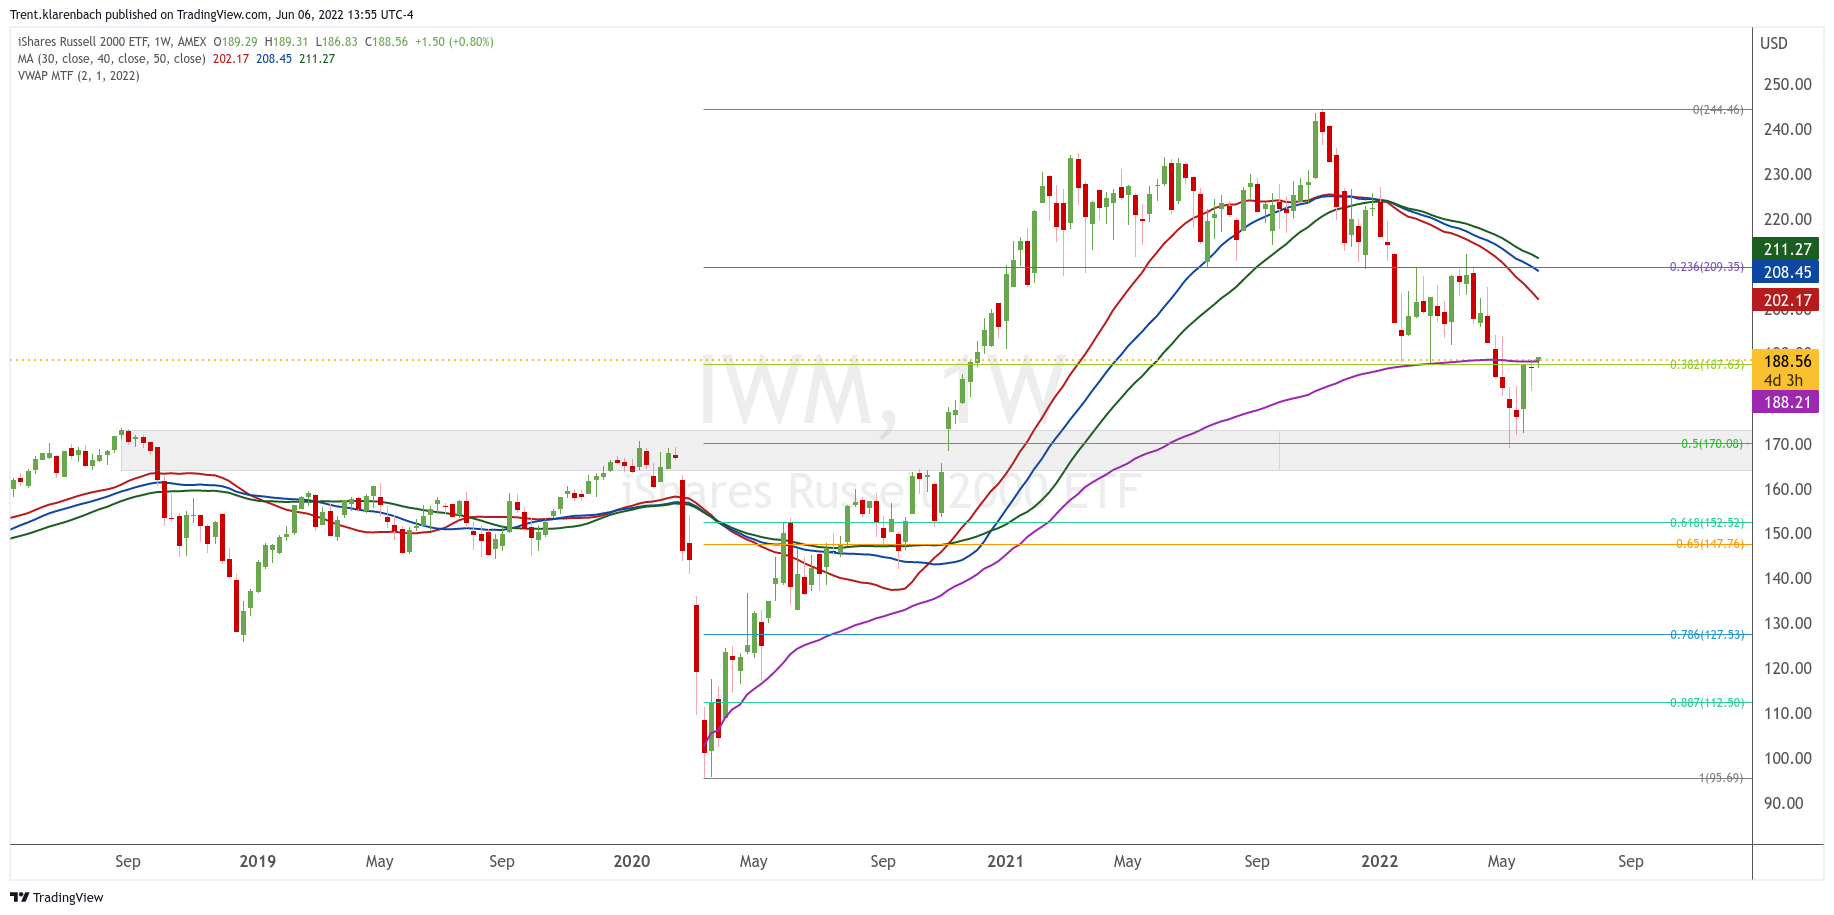
After buyers stepped in near the 2018 and 2020 highs, the Russell 2000 has been battling a critical level with the confluence of the:
Previous support, which often acts as resistance
purple VWAP from the 2020 low
38.2% retracement level
The IWM is a critical level.
TSX - TSX Composite Index

The TSX is holding up relatively well.
The weekly MAs have not begun to cross one another; however, they appear like they will in the coming weeks.
The VWAP from he October 2020 low provided support.
XLF - SPDR SELET SECTOR FUND - FINANCIAL

US Financials have declining weekly MAs also.
Support was found at the confluence of the 38.2% retracement and the purple VWAP from the 2020 low.
WTICUSD - WTI OIL

Oil is making eleven year highs.
My next level of interest is at 138.837 near the 2008 high where I anticipate the price to slow down and maybe pullback to the 115 before pushing higher to 178-180.
DXY - US Dollar Index

The DXY is attempting to break out to six year highs.
A rise in the USD suggests a flight to safety away from risk, ie, the stock market.
If this breakout is successful, then I anticipate a declining stock market.
If their breakout fails, then I consider this bullish for the stock market.
TNX - CBOE 10 TR TREASURY NOTE YIELD
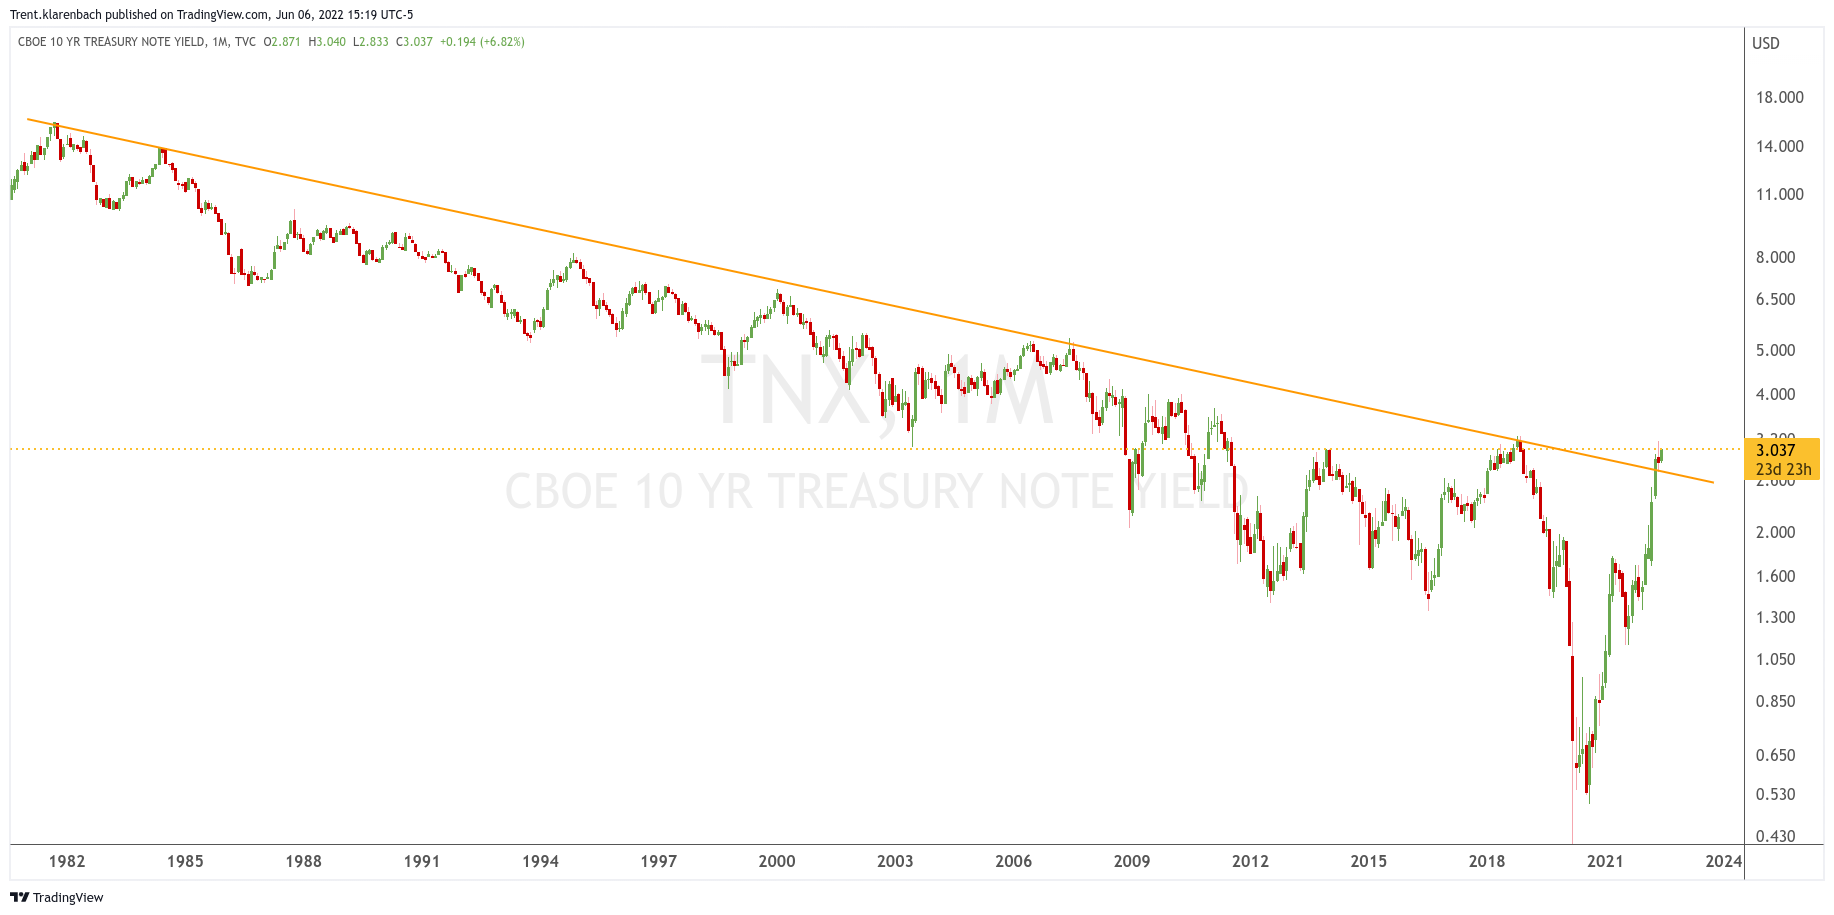
The 10 YR Treasuries have recently broken out of a 41- year trendline.
Yes, a 41-year trendline.
Oh, oh.
DTX - DOW JONES TRANSPORTATION AVERAGE
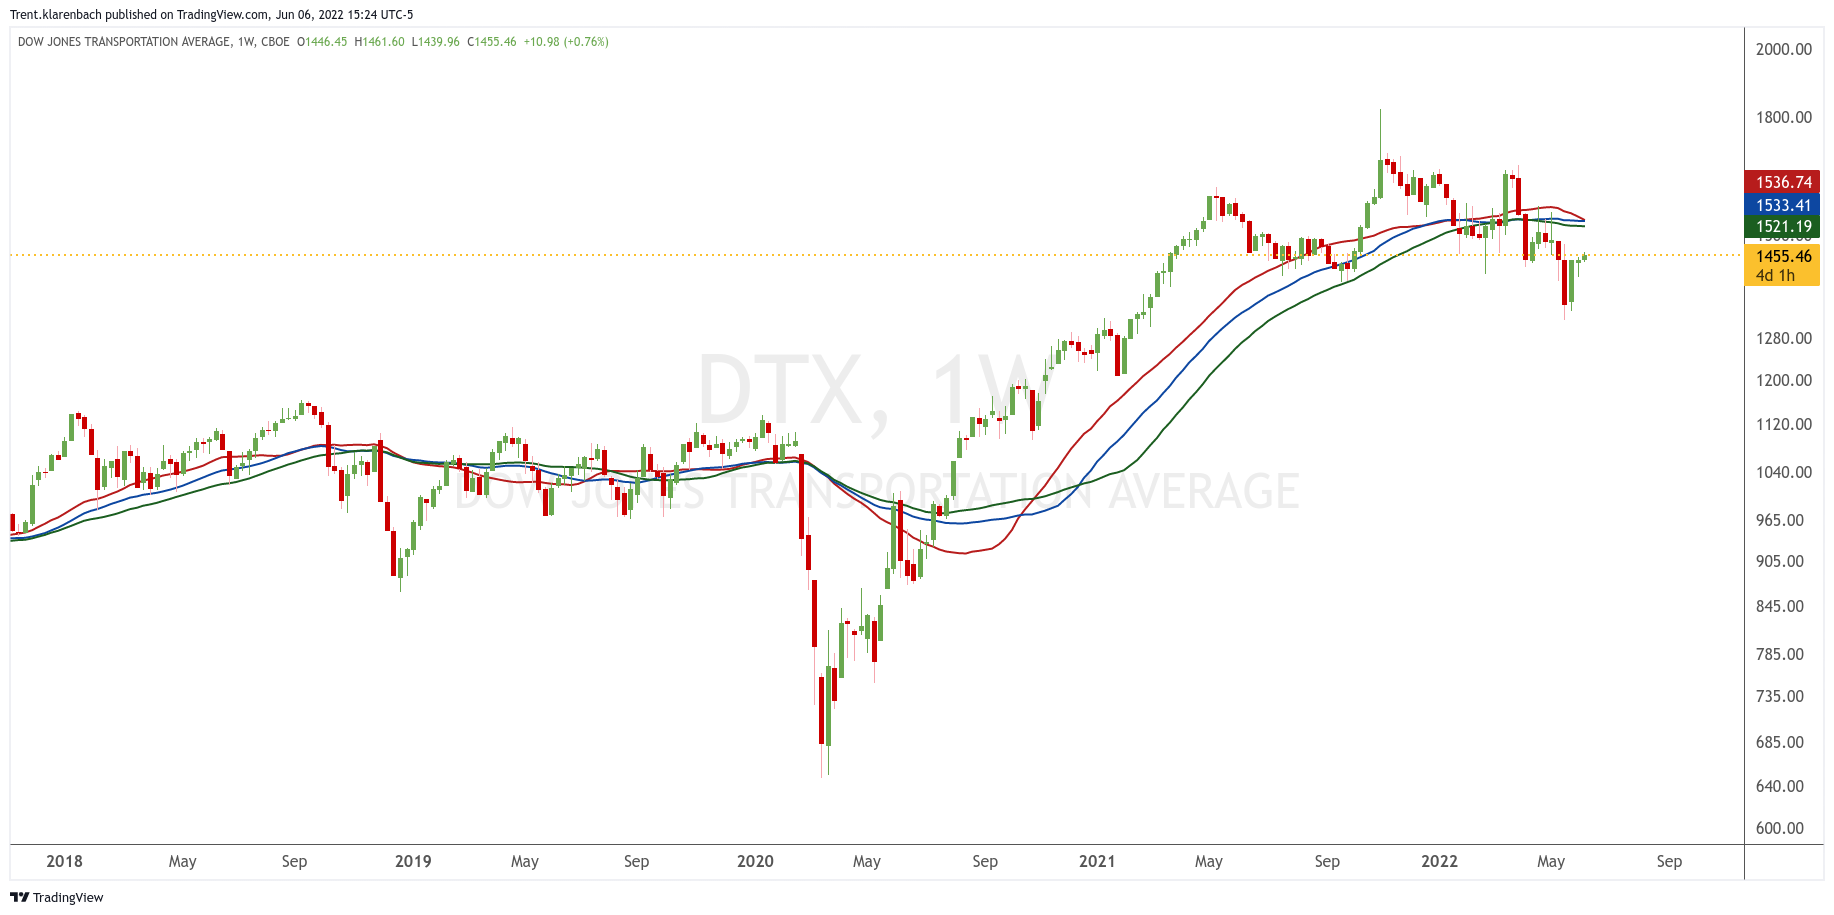
The DTX is recovering from a new weekly low.
The declining MAs are beginning to cross one another signalling the beginning of a downtrend.
What does a downtrending transportation index suggest for the economy?
TRJEFFCRB - COMMODITY CRB INDEX

The CRB continues moving higher into the 2011 highs.
I anticipate these highs to be reached in September which interestingly coincidies with the end of summer and the North American harvest.
Life is good.