


A Warning in Bonds?
Trade Ideas for the Active Investor


I like to monitor the bond market in order to get some sense of what the “smart” money is doing.
This strategy proved to be very effective during January 2020 when Bonds began making new highs above a rising 50 Day Moving Average while the stock market made new highs.
We were cautious and began reducing our long exposure to equities and the market indices.
This morning, IEF (iShares 7-10 Year Treasury Bond ETF) and TLT ( iShares 20+ Year Treasury Bond ETF broke above previous resistance moving higher.
Both ETFs are also above their green 50 Day Moving Average, which I consider Bullish.
The green line in the charts below represents the 50 Day Moving Average.
I highlighted both the 2020 and 2021 new highs above the rising 50 DMA for comparison.
****Click on a chart to enlarge****
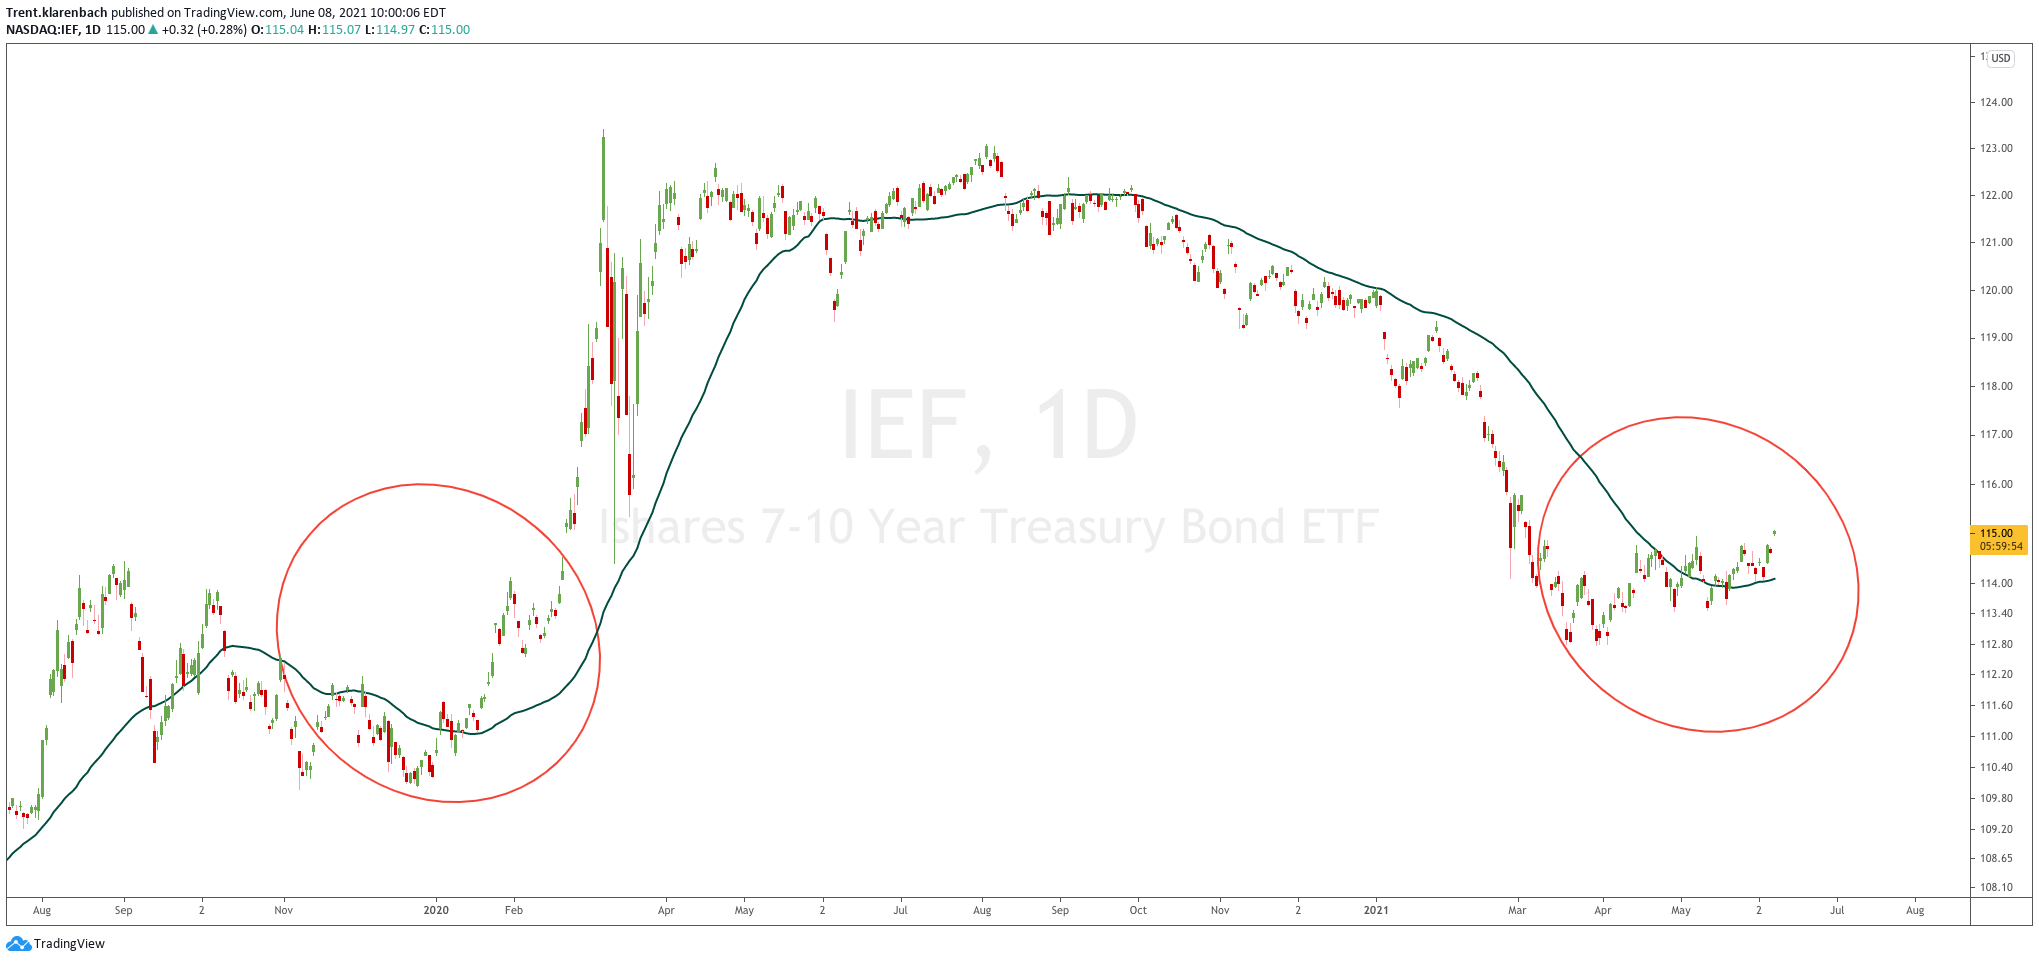
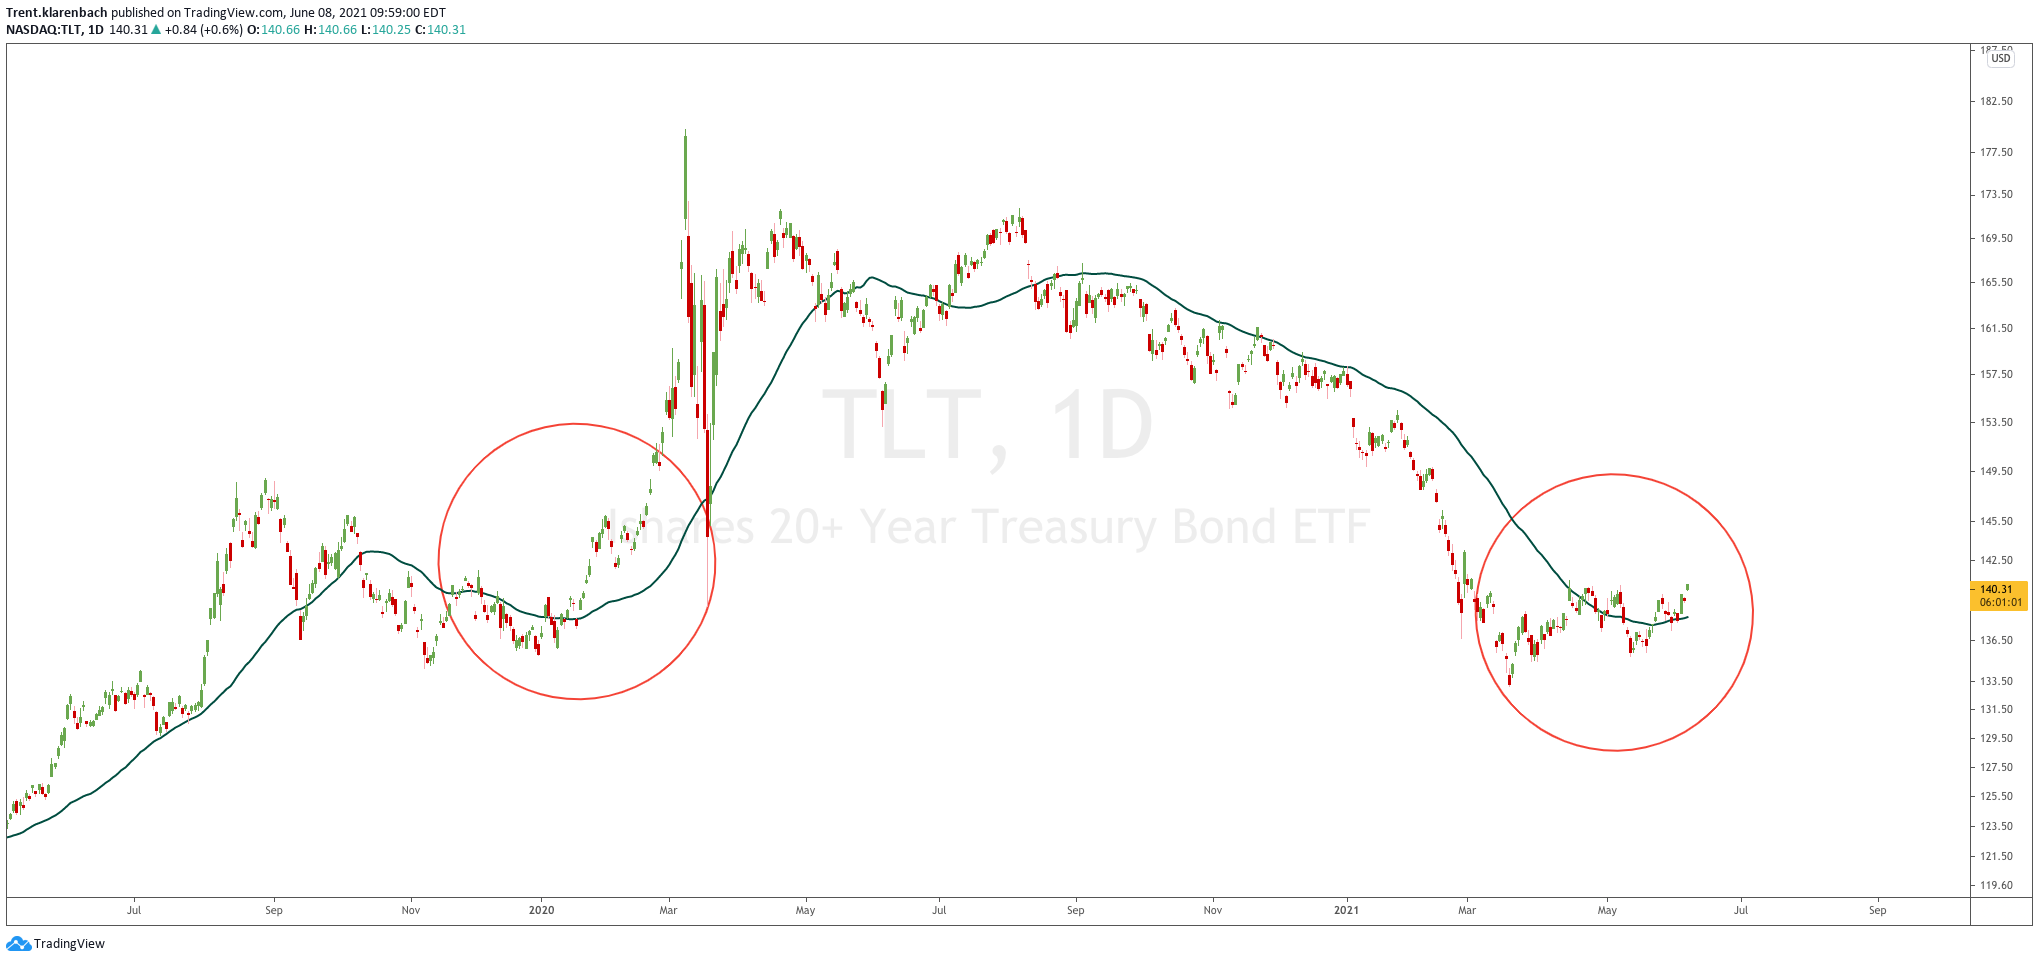
As the above charts suggest, there are currently more bond buyers than sellers.
The chart below compares TLT vs SPY ( S&P 500 ETF)

As the above chart shows, the TLT/SPY ratio recently broke out of a downward trendline and is forming a base below the flattening green 50 DMA.
Looking to the left on the chart, we can compare this time period to last January/February.
The chart below reminds us of what happened in the last 10 days of February 2020.

Will history repeat itself or will the stock markets keep making new highs?
If we do have a correction or crash, will the stock market recover as quickly as this past year?
Maybe you enjoy the stress of a portfolio drawdown and believe that your timeframe allows for a recovery?
Perhaps, you want to avoid the drawdown and buy back at lower values.
I don’t know if the market will correct or crash, however, I believe it is important to anticipate both bullish and bearish scenarios.
I do believe that the bond market is sending a warning that is foolish to ignore.
Life is Good
Each day, I post Trade Ideas with entries and exits in the Klarenbach Research Telegram Group.
For the past year, these ideas have been outperforming the stock market indices by a significant margin.
I track the results in real-time on my website and they can be found with these links: Current year and Last Year.
I enjoy discussing the markets, whether they are currencies, equities, commodities, or bonds.
Let’s have a conversation, and we can explore a new perspective of the markets that you can apply to your analysis.
If you enjoy this newsletter, please subscribe below:
Please share the Klarenbach Report with those who would benefit from this resource.
Drop me a line with any questions or comments. You can do that here.
I am actively posting charts and ideas on social media.
You can find me here:
Klarenbach Research: klarenbach.ca
Twitter: @trentklarenbach
StockTwits: trentklarenbach
Telegram Channel: Klarenbach Research
Tradingview: trent.klarenbach

