


Bitcoin


Bitcoin had an eventful weekend.
Let’s take a look at the charts to get a feel for what happened and what we can look forward to this coming week.
I am going to use a series of charts in an attempt to provide clarity.
**** Click on the chart to enlarge****
I will start with the Bitcoin Tradingview Index Daily chart.
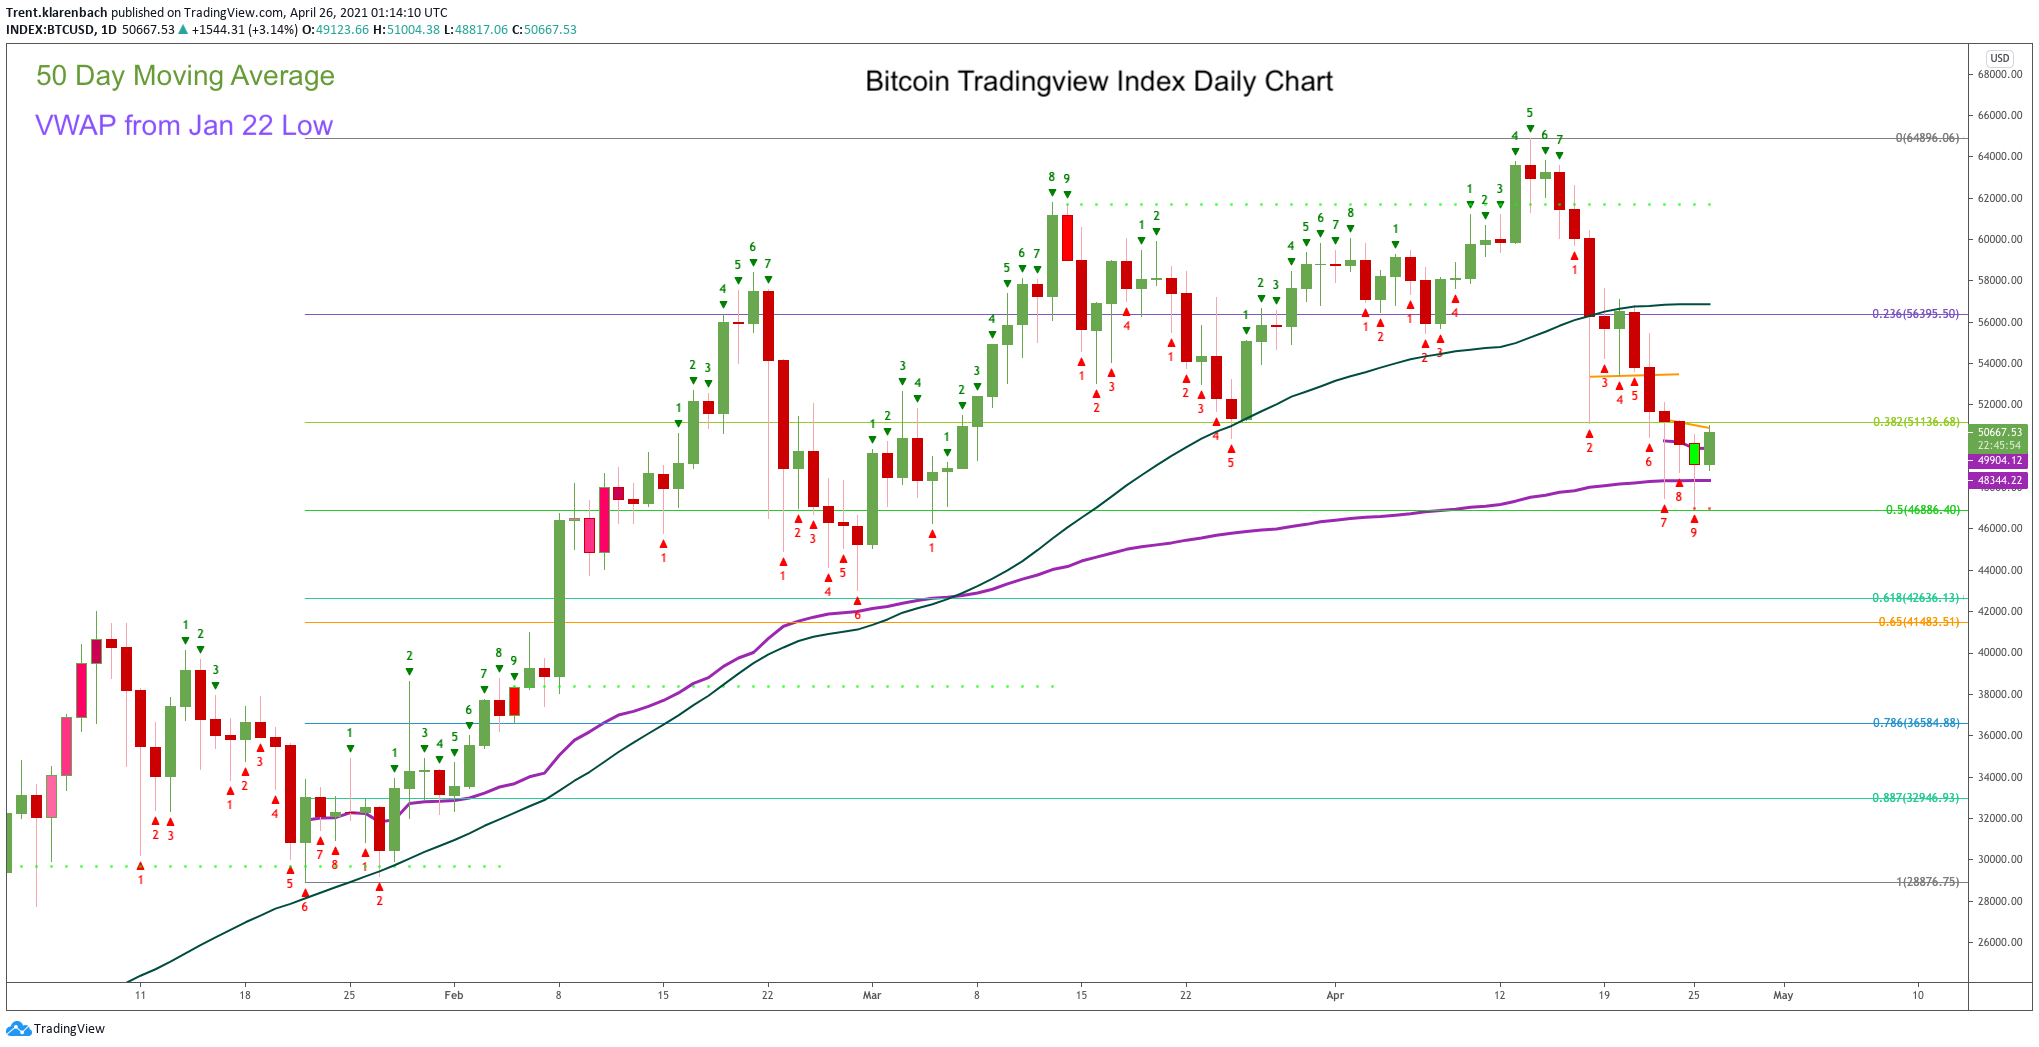
As you can see the price is currently below a flattening 50 DMA. This is short-term bearish.
The price of Bitcoin is considered guilty until proven innocent.
This is a time to cautious if long and new long entries are expected to be short in duration.
I discussed this in my Telegram Group this past week.
The purple line is the VWAP (Volume-Weighted Average Price) from the January 22 low.
The VWAP is a great sentiment indicator as it represents the average price paid per share since that point in time.
The purple VWAP is above the .50 fib level as drawn on this Index chart.
Yesterday’s low is just above the .50 fib level on this Index chart.
This Index includes prices across multiple sources and it is quite likely that the price hit the .50 level on your exchange.
The numbers above the candle s represent an unauthorized version of the TD Sequential Indicator.
I have been watching the Daily chart with interest as the Red TD9 approached the confluence of the VWAP and the fib level for a long entry opportunity.
We got a bounce.
Now what?
This next Daily chart will provide some ideas where the price can go in the short term.

I drew VWAPs from the February 28 low and the All-Time High on April 14.
Below I will describe a few scenarios to be on the alert for.
The price bounces in three waves to the confluence of the red and purple VWAPs , the .50 fib level at $55955 with the 50 DMA acting as resistance before continuing lower to 42K.
The price bounces in three waves to the Golden Zone level of .618 ($58065) and .65 ($58638) before resuming to the downside of the 42K area
I will be watching to see how price behaves and will be continually reassessing.
The idea of a price drop to 42K will be considered invalid with a new all-time high.
Now we wait and see.
Life is Good
I enjoy discussing the markets, whether they are currencies, equities, commodities, or bonds.
Let’s have a conversation, and we can explore a new perspective of the markets that you can apply to your analysis.
If you enjoy this newsletter, please subscribe below:
Please share the Klarenbach Report with those who would benefit from this resource.
Drop me a line with any questions or comments. You can do that here.
I am actively posting charts and ideas on social media.
You can find me here:
Klarenbach Research: klarenbach.ca
Twitter: @trentklarenbach
StockTwits: trentklarenbach
Telegram Channel: Klarenbach Research
Tradingview: trent.klarenbach