


CAD USD Analysis
Trade Ideas for the Active Investor


The CADUSD pair is interesting to me.
Let’s take a look at some charts.
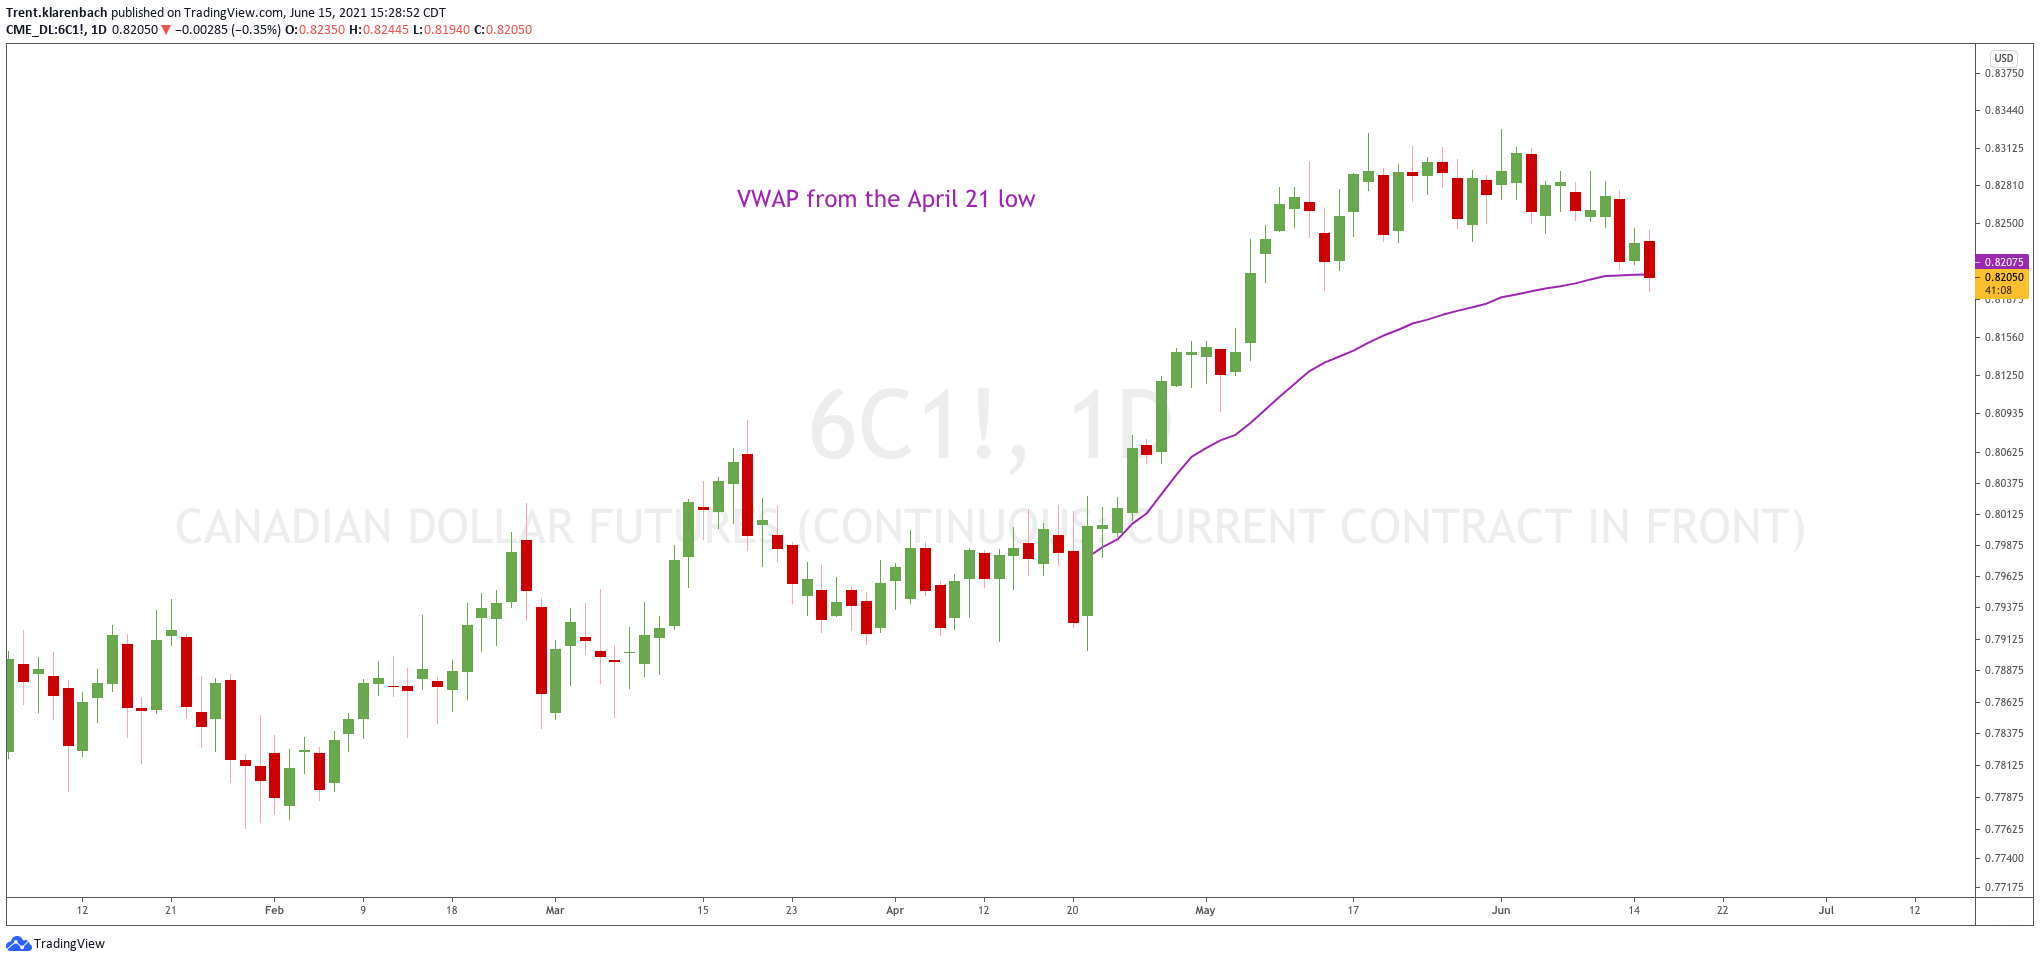
The first chart is the CAD Futures: Continuous Contract in Front.
I have the anchored VWAP from the April 21 low sitting at .82075.
I anticipate a bounce from this level, however, I am short-term bearish below that level.
The anchored VWAP represents the average price paid per contract since that time period.
If the price is above the VWAP, the average long position holder is profitable and feels good about their trade and more likely to add than sell.
If the price is below the VWAP, the average long position holder is losing money and is more likely to sell than add to their position.
This next chart is the USDCAD showing the purple VWAP from the same April 21 date.
Also showing is a TD 9 count on the Daily chart suggesting a 1-4 day pullback,

If the price can get back above the purple VWAP, I anticipate moving into the previous supply highlighted by the grey rectangle.
Life is Good
Each day, I post Trade Ideas with entries and exits in the Klarenbach Research Telegram Group.
For the past year, these ideas have been outperforming the stock market indices by a significant margin.
I track the results in real-time on my website and they can be found with these links: Current year and Last Year.
I enjoy discussing the markets, whether they are currencies, equities, commodities, or bonds.
Let’s have a conversation, and we can explore a new perspective of the markets that you can apply to your analysis.
If you enjoy this newsletter, please subscribe below:
Please share the Klarenbach Report with those who would benefit from this resource.
Drop me a line with any questions or comments. You can do that here.
I am actively posting charts and ideas on social media.
You can find me here:
Klarenbach Research: klarenbach.ca
Twitter: @trentklarenbach
StockTwits: trentklarenbach
Telegram Channel: Klarenbach Research
Tradingview: trent.klarenbach