


There are several reasons to own gold.
The website Investopedia lists the following 8 reasons:
A history of value
A hedge against fiat currencies
A hedge against inflation
Deflation protection
Geopolitical Uncertainty
Supply constraints
Increasing demand
Portfolio Diversification
I don’t care about any of those reasons; the only thing I care about is the price.
And the price is at an interesting level for me.
Let me explain.
Below is the daily Gold Futures chart.
****Click on the chart to enlarge****
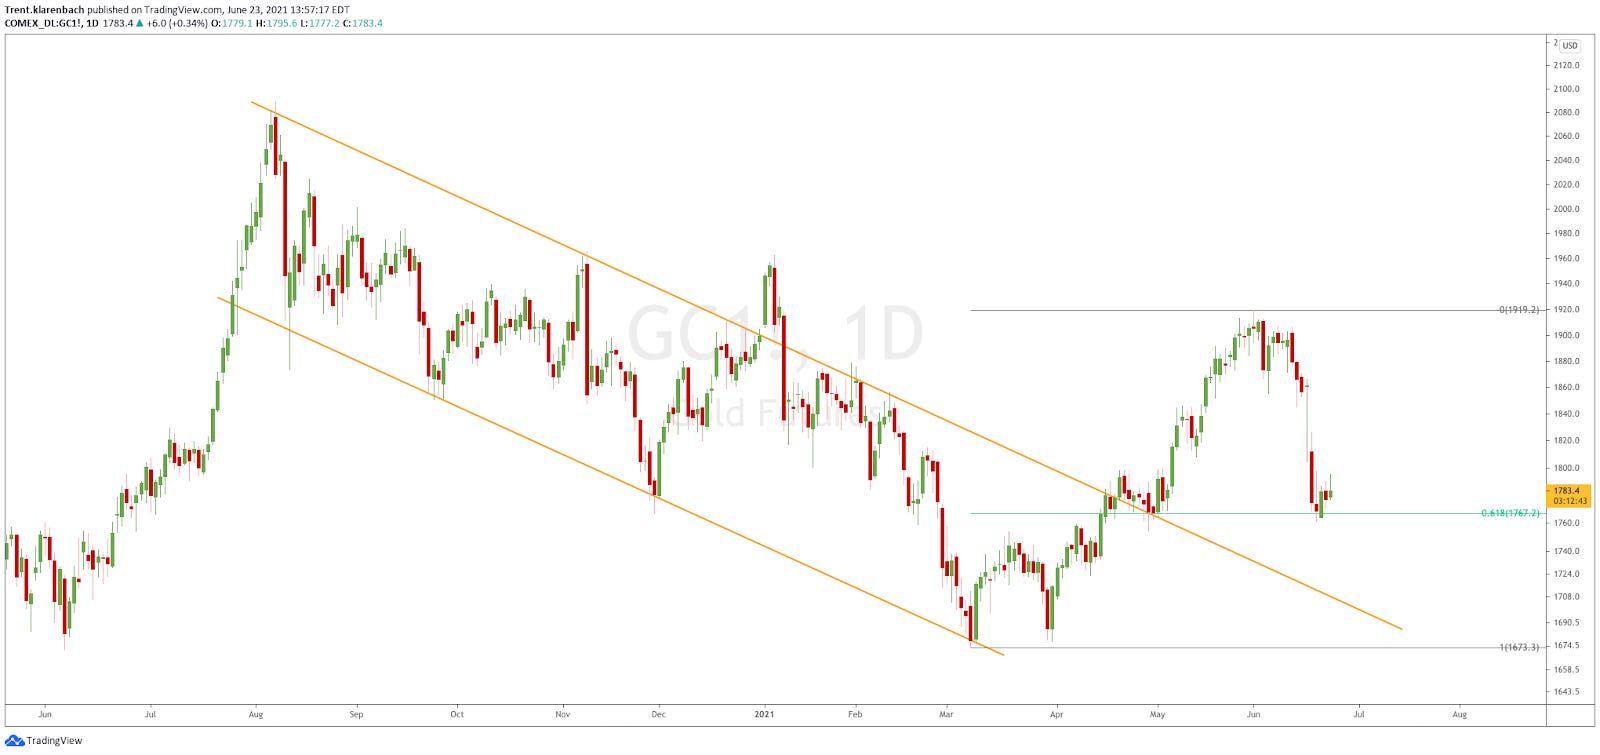
Gold made a new all-time high of $2089 in August 2020 and has since pulled back in a channel pattern, making a low of $1673 in March of this year.
The price rallied off that March low to $1919 and is now retracing to the vicinity of the upper trendline.
Technicians try to identify areas of interest of potential supply of buyers or sellers. There are many different ways to do this, and one of my preferred methods is to use the Fibonacci Retracement Tool.
I encourage you to become familiar with Fibonacci numbers and sequence. It is a fascinating topic, and you will never look at anything in this world the same way again.
There are several quality charting platforms that provide this tool. If your charting platform is not one of these, you can visit my website for savings on ones that do. https://www.klarenbach.ca/affiliates
When I apply the Fibonacci Retracement tool to this recent move using the low of $1673 and the high of $1919, we calculate the 0.618 retracement level to be $1767.
As you can see in the chart above, buyers have stepped in at this level, providing a low-risk entry for a long position.
I am interested in being long gold at this level and will manage my risk with a stop under the new low.
If the price moves lower and I get stopped out of my trade, my loss will be minimal.
The Fibonacci Retracement tool is a valuable tool to identify areas of the potential supply of buyers and sellers.
That is all for today.