HOG FUTURES STRATEGY


I recently became reinvolved with a hog barn that a number of local investors, myself included, established in the late 1990’s during the Saskatchewan hog boom.
The barn has and continues to be a success with an excellent manager and a strong board of directors.
My goal is to demonstrate some risk management strategies to the current board which may be implemented if successful.
As a result, I established a CME Practice Simulator account to provide transparency to these strategies.
The following consists of the current positions, overall market analysis and discussion on our open positions.
This analysis is available for all stocks, commodities, FX and cryptocurrencies.
HOG FUTURES STRATEGY
As discussed, I opened a CME Practice Simulator in order to analyze some risk management strategies using CME Futures.
I use Technical Analysis and do not rely on mine or others’ interpretation of fundamentals.
I am not pretending to know what I don’t know.
My Trend Following strategy uses price action and moving averages to determine the beginning and the end of trends.
I currently refer to a number of indicators and oscillators including the following:
RSI - Relative Strength Index
MACD - Moving Average Convergence Divergence
Moving Averages - Typically 20 DMA, 50 DMA, 200 DMA, 30 Week MA, 40 Week MA and the 50 Week Moving Average
VWAP - Volume Weighted Average Price
Volume -
TD Sequential
Fibonacci Retracements and Extensions
While I try to keep the analysis simple, I do review each of these in an attempt to discover a high probability, low-risk idea.
The entire purpose of this exercise is to determine if we can consistently reduce our downside risk while allowing the upside price action to work in our favour.
I believe that we will have positive results.
Let us find out.
CME PRACTICE SIMULATOR
CURRENT POSITIONS
Currently, using the CME Practice Simulator, I have the following Open Positions.
As you can see, I am attempting to reduce the downside risk if the price drops further.
As each of these contacts is for 40,000 lbs, conducting a proper hedge exiting the future contract upon the sale of the physical will not be achieved in this exercise.
Therefore, discretion will be required for exiting the Futures contract.
Here is a link to the contract specs: https://www.cmegroup.com/trading/agricultural/livestock/lean-hogs_contract_specifications.html

LEAN HOG FUTURES
(CONTINUOUS: CURRENT CONTRACT IN FRONT)
The Continuous: Current Contract In Front chart is my reference for long-term hog price analysis as each contract is automatically rolled into the next.
The following charts are using the Daily timeframe.

Let’s zoom in closer.

The charts above show the price consolidating below the rising green 50 Day Moving Average (DMA).
The rising 50 DMA is a good thing. The Price below it is not.

The price above the light blue Year-to-Date VWAP (Volume Weighted Average Price) is bullish as the average price paid for a contract since the start of the year has made money. People are feeling pretty good about their positions.
The purple 200 Day Moving Average (DMA) is starting to rise ever so slightly.
The red rectangle has been acting as an area of support with price testing it numerous times.
With the price below the 50 DMA and repeatedly testing this area, I am anticipating that this area of support will break. Hence, the short positions.
The chart below shows my areas of interest if the support does break.
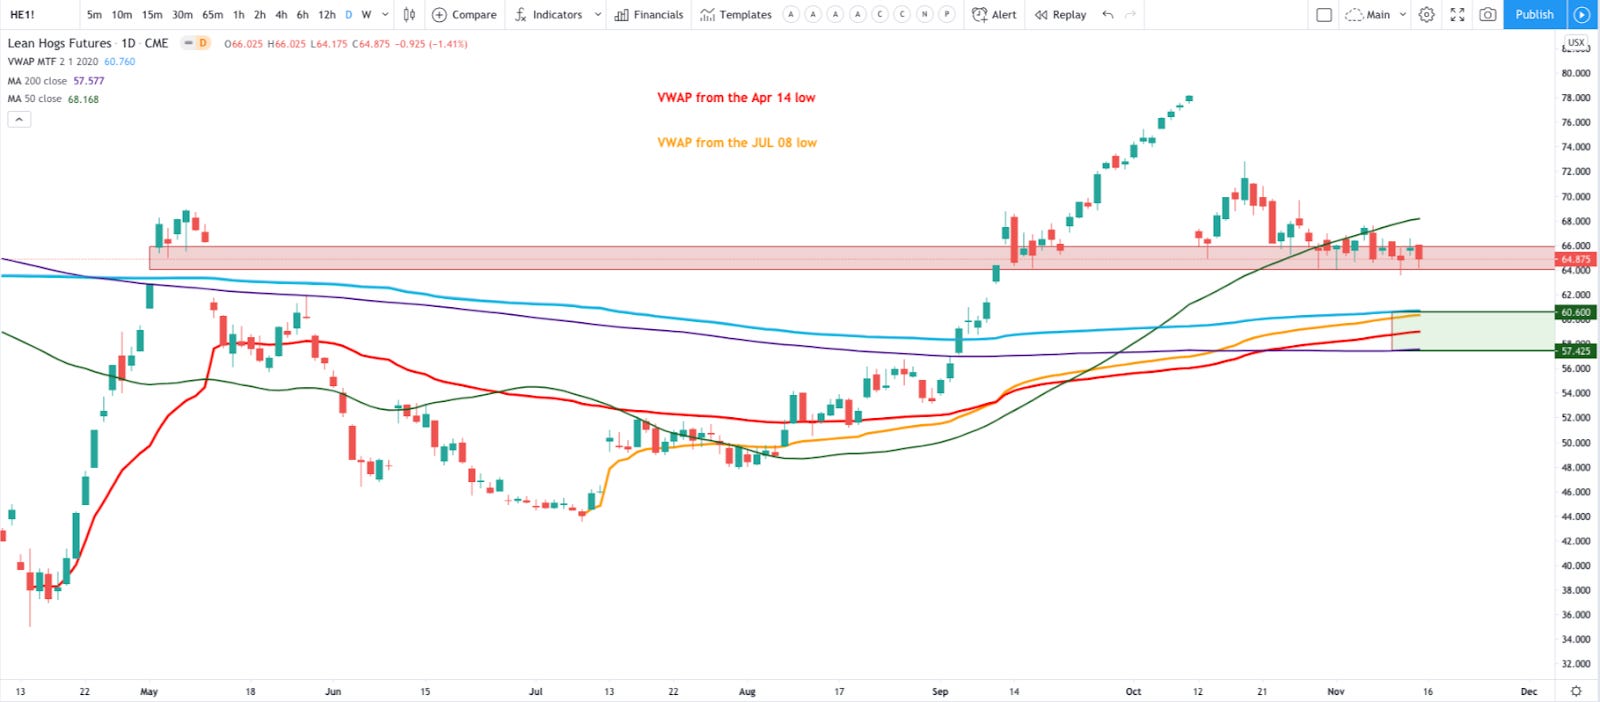
The green rectangle marks my area of interest where buyers could be found in the event the red support breaks.
This upper boundary of the green rectangle marks the confluence of the light blue YTD VWAP and the orange VWAP from the July 08 low.
The lower boundary of the green rectangle is the 200 DMA.
The red VWAP from the April 14 low is between these two boundaries.
LEAN HOG FUTURES
DEC 2020
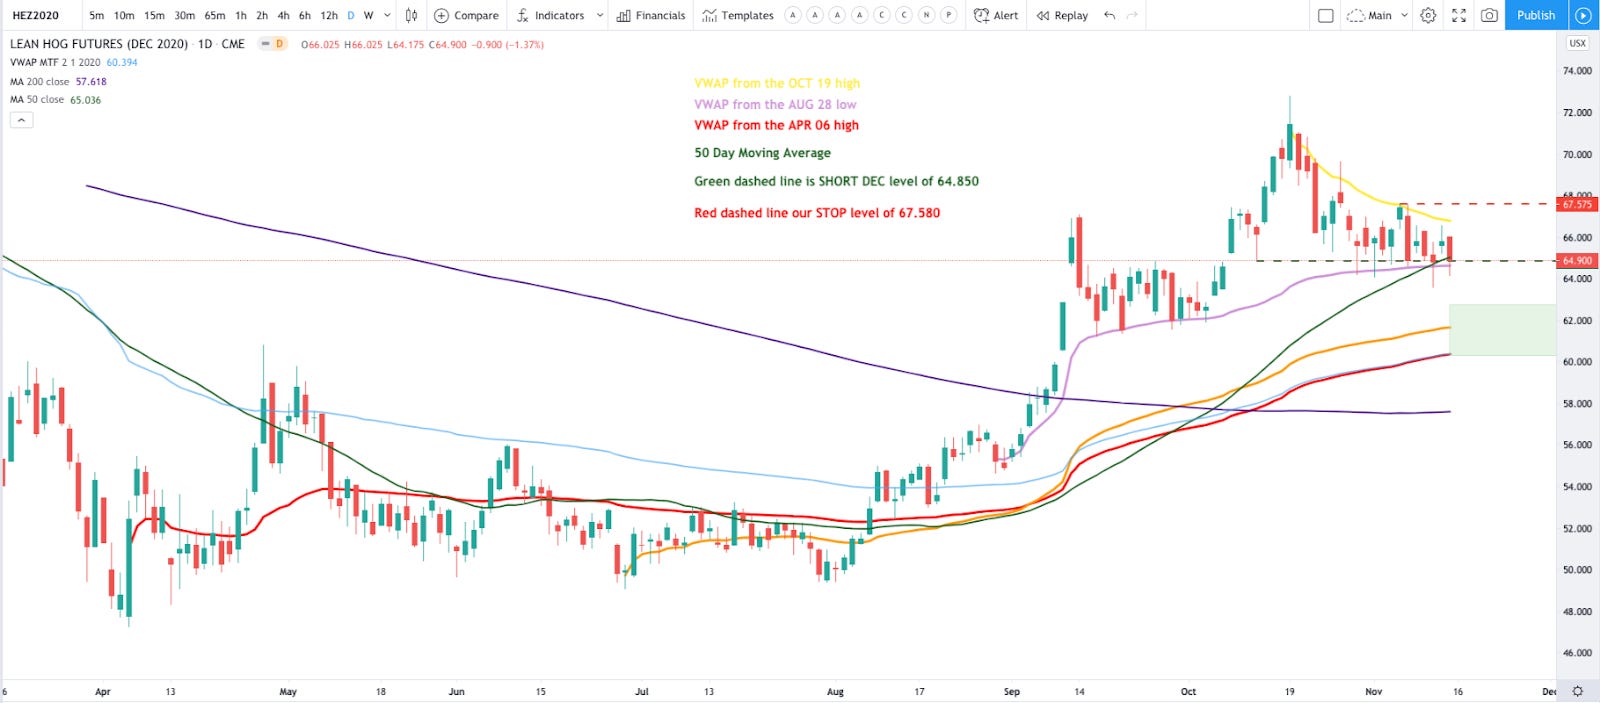
The above chart shows our short entry position of 64.850 in green and our stop level of 67.580.
I entered this position upon the breakdown of the consolidation and the light purple VWAP.
Remember, the price is below the 50 DMA.
As you can see, the price is testing the light purple VWAP from the August move. The more times support is tested, the more likely it is to break.
Our stop level represents a new swing high and a short-term trend change.
We will continue to move our stop lower given the opportunity.
The green rectangle is my area of interest and possible support with the September support levels and the VWAP from the April and June lows.
LEAN HOG FUTURES
FEB 2021

Our stop level represents a new swing high and a short-term trend change.
The above chart shows our short entry position of 66.820 and our stop of 68.800.
I entered the short position with price breaking below previous support, below the 50 DMA and the yellow VWAP from the swing high.
We will continue to move our stop lower given the opportunity.
The green rectangle represents an area of interest with the 200 DMA and previous support and resistance levels.
Drop me a line with any questions or comments. You can do that here
I am actively posting charts and ideas on social media.
You can find me here:
Klarenbach Research: klarenbach.ca
Twitter: @trentklarenbach
StockTwits: trentklarenbach
Telegram Channel: Klarenbach Research
Tradingview: trent.klarenbach
I hope that you find the Klarenbach Report worthy of your time and that you choose to hit the subscribe button below.
Please share with anyone else that you think may enjoy it also.
Life is Good
The Klarenbach Report is sponsored by Mojocial Media.