Inflection Point?


June 21, 2020
This is a fascinating time in the markets.
Are the markets going to new all-time highs?
Are the millennial Robin Hood traders driving markets and outwitting Wall Street?
Do the fundamentals matter?
Is the USD collapsing?
Is the S&P 500 and the DOW at an inflection point?
I recently began an Introduction to Trading and Investing Workshop that will provide you with the tools and confidence to take control of your investments.
I believe that this workshop will be of great benefit to both new traders and veteran investors. You can sign up on my website with this link: Trading and Investing Workshop
Our free Telegram channel, Klarenbach Research, is growing in numbers and the members are getting more comfortable with asking questions regarding traditional markets and Bitcoin.
This is the link https://t.me/klarenbachresearch.
I hope you check it out.
We have had good luck with our Trade Ideas and the ideas posted on our Telegram channel.
I have included the Trade Results Summary. The number of trades is becoming too lengthy for this publication.

As you can see, finding Investor Class Ideas has proven difficult with more success with Swing Trade Ideas and the Telegram channel. There are a few blemishes, but overall we are pleased with our results.
MARKET REVIEW
This is a fascinating time in the markets.
Are the markets going to new all-time highs?
Are the millennial Robin Hood traders driving markets and outwitting Wall street?
Do the fundamentals matter?
Is the USD collapsing?
Is the S&P 500 and the DOW at an inflection point?
**Click on any chart to enlarge**
S&P 500 Index (SPX)
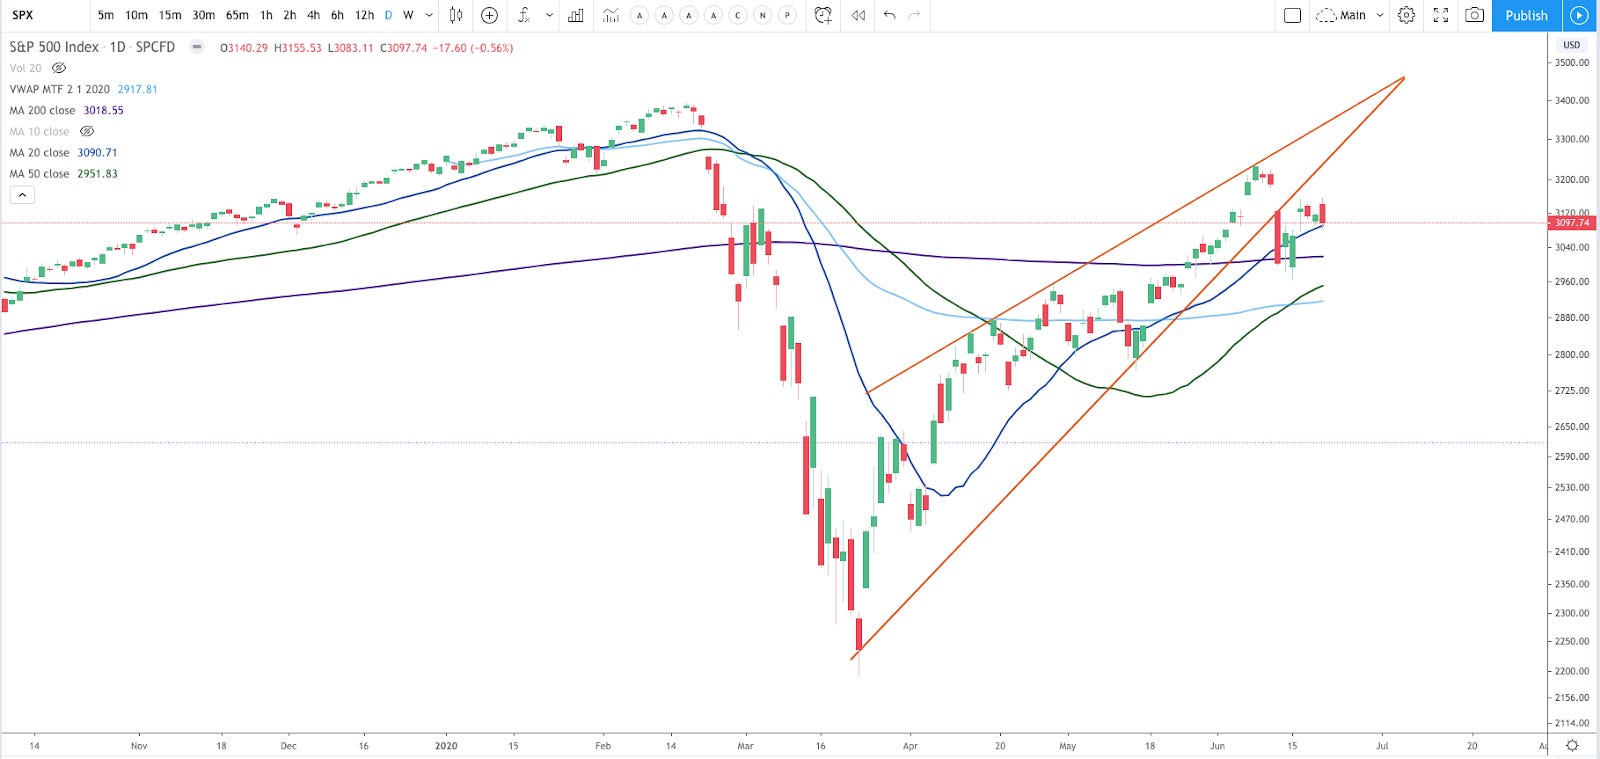
I see price breaking out of a rising wedge on the Daily chart with an attempt to pull back retesting the bottom trend line.
This is a bearish pattern and time will tell if this a false breakout or we are going lower, much lower.
I still believe that this is a dead cat bounce and feel better about the idea this week than last.
At this time, I still consider the B Wave from my March 26 tweet near completion and am waiting for confirmation of the C wave formation.

NASDAQ 100 INDEX (NDX)

NDX is backtesting new all-time highs. Software and the cloud…….
Dow Jones Industrial Average (DJIA)

The DJI appears to have broken out of a rising wedge and completed pullback to the bottom trendline. Is this a false breakout or are lower prices in the future?
Price is below the 200 DMA which is considered bearish.
ISHARES TRUST RUSSELL 2000 ETF (IWM)

The Russell 2000 is inside a channel and back below the 200 DMA. This is bearish from a 200 DMA perspective and will get really bearish if price breaks out of the channel to the downside.
TSX Composite Index (TSX)
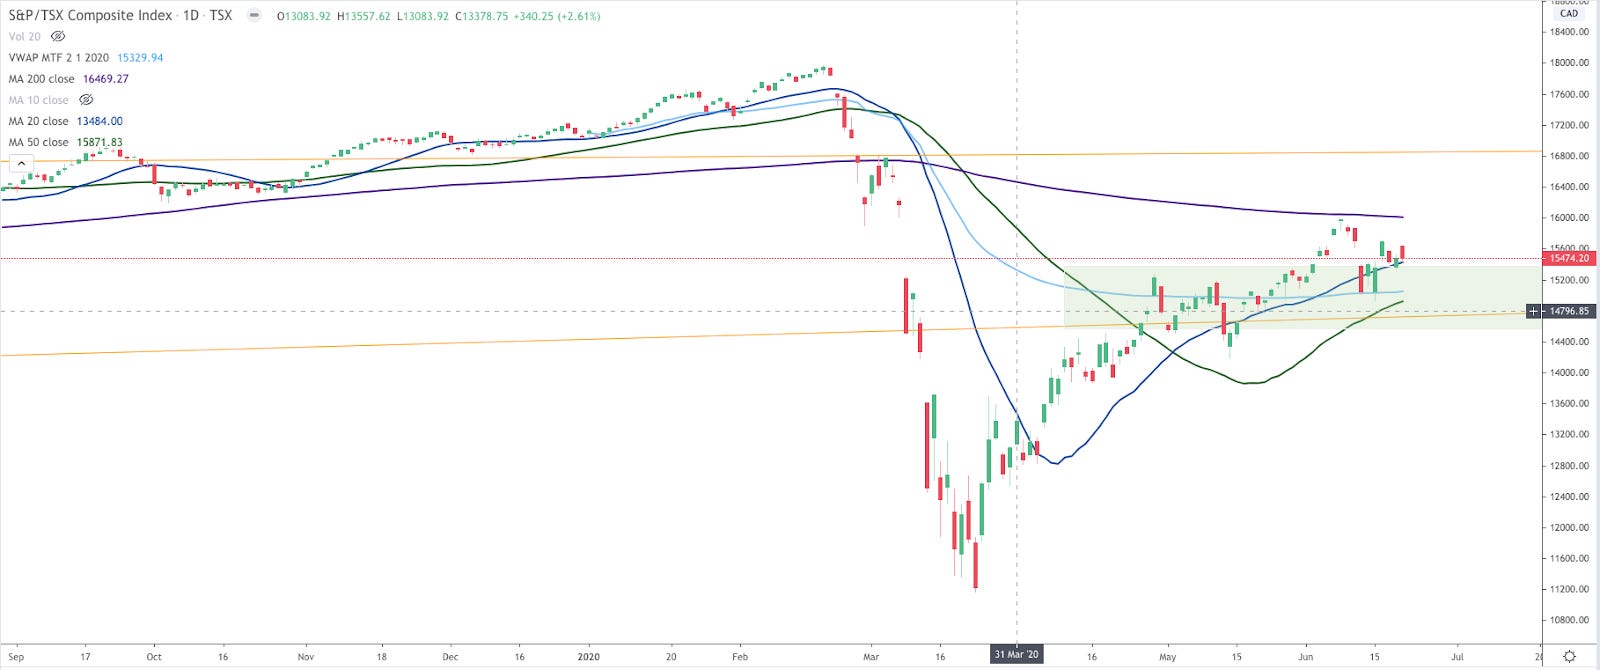
Price found support at the YTD VWAP, however, it is still below the declining 200 DMA. This looks bearish to me. This green area of interest has presented in this chart for months now.
S&P 500 Volatility Index (VIX)

The VIX is above a flattening 50 DMA, a rising 20- and 200 DMA.
What happens when the VIX rises?
A rise in the VIX most often means a drop in the S&P 500.
West Texas Oil (WTIC)

WTI is at the YTD VWAP and the .5 fib level from the 2020 high and low. Yeah, these things matter.
GOLD Spot (XAUUSD)
Gold appears ready to break out to new highs. What does this mean for the USD and stock market?
US Dollar / Canadian Dollar (USDCAD)

USDCAD found some buyers late in the week. I expect a retest in the area of the red horizontal line. Will that happen before or after my measured move green target area is reached?
US Dollar Currency Index (DXY)

A wedge or channel could be drawn on this recent price action. I chose to draw a rising wedge as I am considering that the two false breakouts negate each other.
For you Star Wars fans, on the monthly chart, those two breakouts appear as the March candle representing what is known as a Darth Maul candle.
BITCOIN (BTC)

BTC is inside what appears to be an ascending triangle forming. Price is below a declining 50 DMA which is concerning.
WHEAT FUTURES (ZW1!)

We have been anticipating that price may test and find support at the confluence of the 200 Week and the yellow trend line. This week it happened. A long position here with a stop below last week’s low looks attractive to me.
From previous weeks:
Wheat looks like it wants to test the area where the 200 Week MA and yellow trend line converge. That level could be an opportunity to go long.
SOYBEAN FUTURES (ZS1!)

Soybeans continue to look like they are breaking out of this falling wedge. We have been discussing this for weeks. This is good for farmers.
Buyers were found at the light blue YTD VWAP.
TLT vs SPY
(ISHARES 20+ YEAR TREASURY BOND ETF vs SPDR S&P 500 ETF TRUST

Nice bounce off the 200 DMA.
SHOPIFY INC (SHOP)
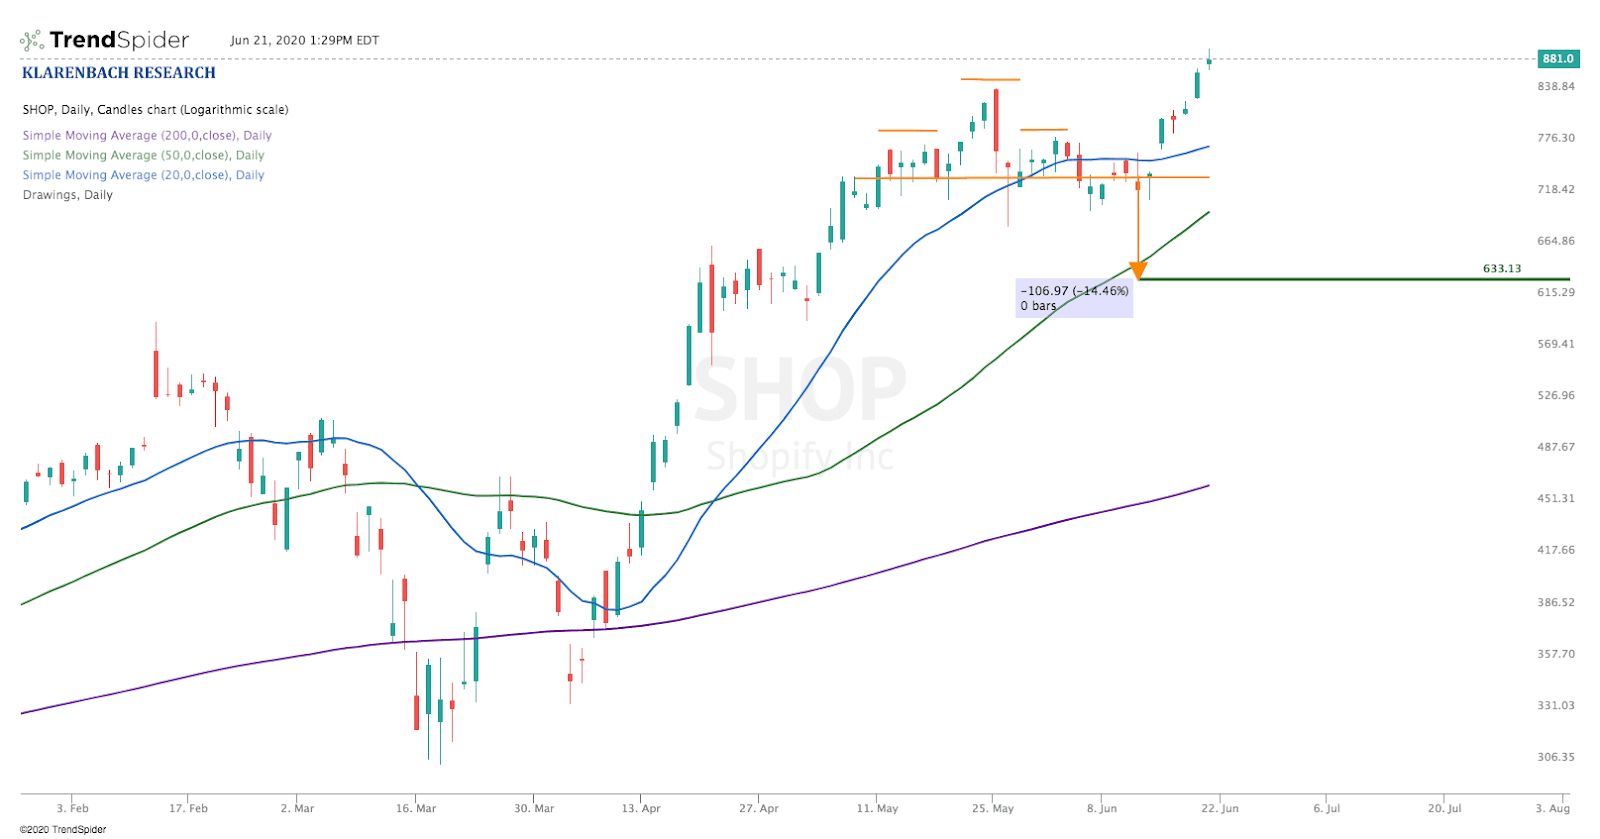
I thought that SHOP was due for a correction. Instead, we got new highs. Beast Mode.
I have posted SHOP ideas on TradingView which can be found here https://www.tradingview.com/chart/SHOP/khIJUje2-SHOP-Elliot-Wave-Idea/ and here https://www.tradingview.com/chart/SHOP/nellgdwz-SHOP-Hyperwave/
INVESTOR CLASS IDEAS
The Investor Class opportunities remain pretty thin as I don’t have many meeting my Investor Class Criteria for this week.
I will post in the Telegram Channel as Trade Ideas develop and are identified during the week.
Here is the link: https://t.me/klarenbachresearch
REMEMBER, CASH IS A POSITION
Don’t FOMO into a position. Have a plan.
TERP (NASDAQ) TERRAFORM POWER

I am interested in TERP above 19.67 with a stop below 17.19. TERP is above the 30-, 40- and 50- Week MAs as well as the advancing 50- and 200 Day MAs. Price is consolidating and looks like it could move higher.
TNDM (NASDAQ) TANDEM DIABETES CARE

I am interested in TNDM as an Investor Class trade on a breakout above last week’s highs at 92.95 with the initial stop below 75.26.
SWING TRADE IDEAS
The market feels toppy to me and after last week's experiences, I am giving the market time to indicate it's direction.
Swing trades will be posted as they are identified in the Klarenbach Research Telegram Channel.
Here is the link: https://t.me/klarenbachresearch
PZZA (NASDAQ) PAPA JOHN’S INTL.

PZZA looks like it is ready to break to a new ATH. Nice consolidation at the highs. I am interested above 84.28 with a stop below 80.74.
That is all for now!
Drop me a line with any questions or comments. You can do that here
I am actively posting charts and ideas on social media.
You can find me here:
Klarenbach Research: klarenbach.ca
Telegram: Klarenbach Research
Twitter: @trentklarenbach
StockTwits: trentklarenbach
Tradingview: trent.klarenbach
I hope that you find the FREE Klarenbach Report worthy of your time and that you choose to hit the subscribe button below.
Please share with anyone else that you think may enjoy it also.
Remember... It is FREE!
Life is Good

The Klarenbach Report is sponsored by Mojocial Media.