


Is The Top In?


September 07, 2020
I did not publish the previous two weeks due to family commitments and travel.
The markets experienced a significant pullback in the latter stages of last week.
Captial seems to be rotating from tech stocks into Airlines, Resorts and Casinos. It is hard to imagine this; however, there is strong evidence that this is happening.
As well, the Ag charts that we follow suggest that we could be entering a golden age of agriculture.
I recently began an Introduction to Trading and Investing Workshop that will provide you with the tools and confidence to take control of your investments.
I believe that this workshop will be of great benefit to both new traders and veteran investors. You can sign up on my website with this link: Trading and Investing Workshop.
If no dates are available, reach out to me.
Our free Telegram Group, Klarenbach Research, is growing in numbers, and the members are getting more comfortable with asking questions regarding traditional markets and Bitcoin.
We post entries, stops and exits so that members can learn how to identify low-risk high probability trades.
Some of our members are catching on quickly and are experiencing success in their trading accounts.
The Telegram Group is where the majority of the ideas are posted. Talk to someone who is in the Group and ask them how the results have been.
Here is the link https://t.me/klarenbachresearch.
I hope you check it out.
We have had success with our Trade Ideas and the ideas posted on our Telegram Group.
I have included the Trade Results Summary.
The number of trades is becoming too lengthy for this publication.
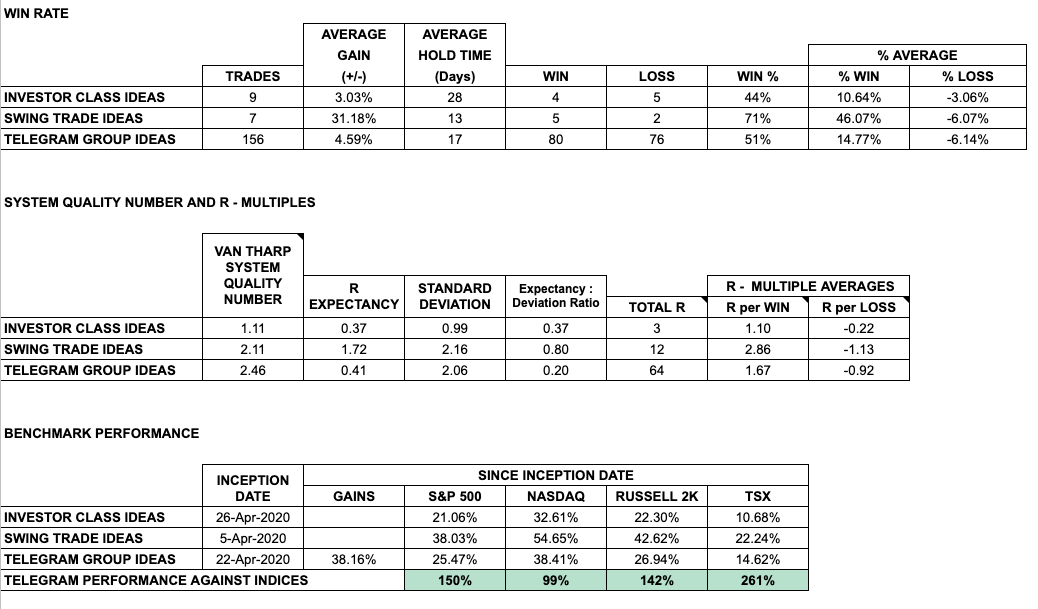
The Open Trades in the Investor Class Ideas were each up over 9% at the start of the week only to get hit hard with the late week sell-off.
The expectancy of the Telegram Group Ideas is 4.59% for a 17-day hold.
Extrapolated out to a 30-day month, and the result is an 8.1% monthly gain.
I adopted components of Van Tharp’s System Evaluation, which I believe is more effective for system evaluation than win rates and % gains.
MARKET REVIEW
**Click on any chart to enlarge**
SPDR S&P 500 ETF TRUST (SPY)
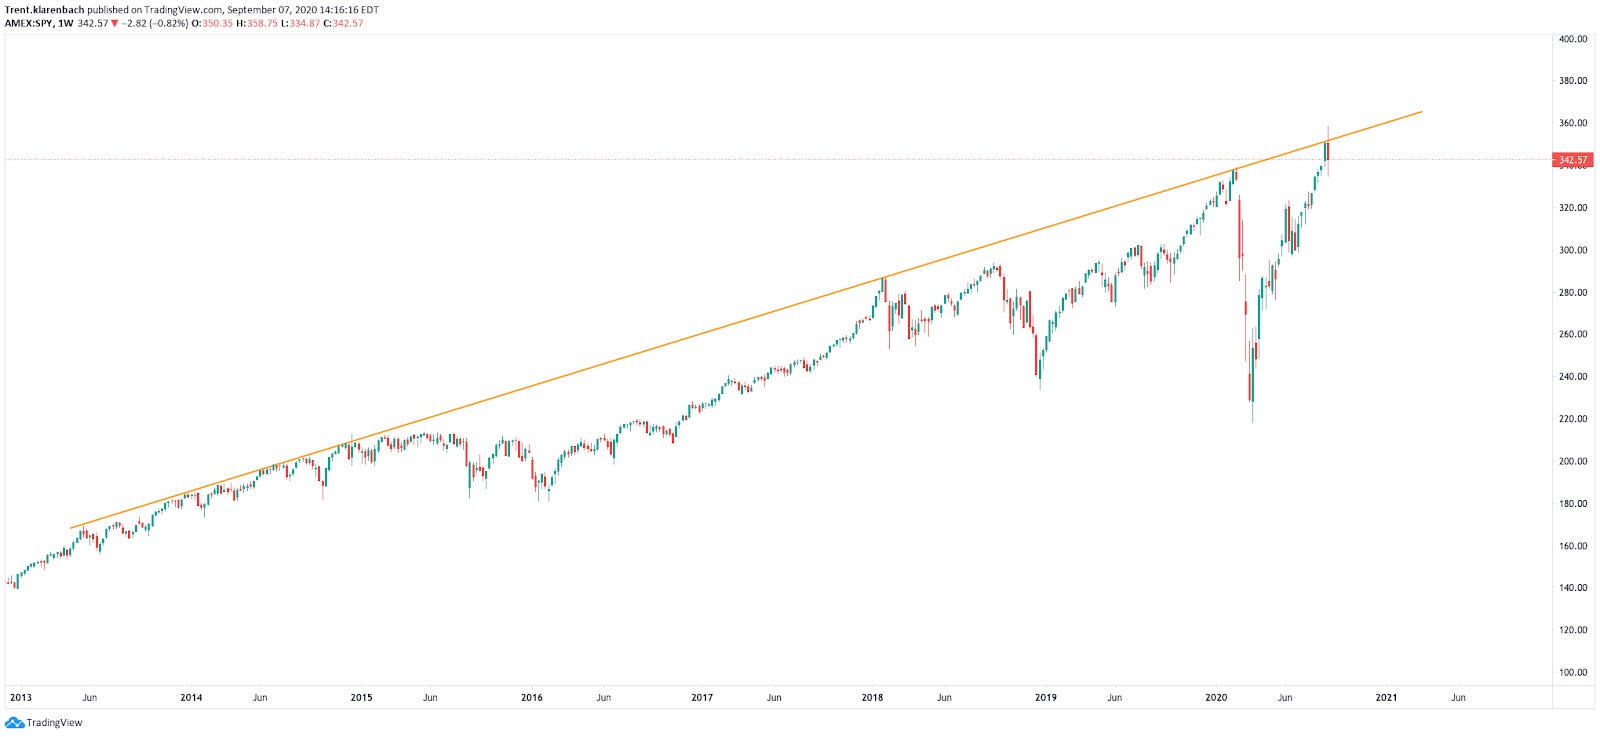
The S&P 500 made new highs and found resistance at this trendline from 2013. Price has retraced significantly each time this trendline has been tested in the past.
INVESCO QQQ TRUST NASDAQ 100 ETF (QQQ)

This bearish engulfing candle on the weekly chart suggests lower prices to come.
SPDR DOW JONES INDUSTRIAL AVERAGE ETF (DIA)

The Dow filled the Feb 24 gap; however, it is still below the ATH.
ISHARES TRUST RUSSELL 2000 ETF (IWM)

This bearish engulfing candle on the weekly chart suggests lower prices to come.
TSX Composite Index (TSX)

The TSX found buyers at the 50 DMA. Let’s see if that holds.
S&P 500 Volatility Index (VIX)

The Telegram Group has been watching for this breakout above the trendline in anticipating a retrace in the S&P 500. We tightened our stops early in the week in anticipation.
West Texas Oil (WTIC)

Oil is below the trendline and the declining 50- and 200- DMA. Buyers were found at the light blue YTD VWAP. Note how the price found the top at the .236 fib level. This is the .236 retracement level from the ATH in July 2008 and the 2020 low. There are a lot of eyes of on a lot of things. This is a bearish chart.
GOLD Spot (XAUUSD)

Gold looks weak to me with this descending triangle forming on the daily chart. The green 50 DMA below may slow the decline down.
US Dollar / Canadian Dollar (USDCAD)
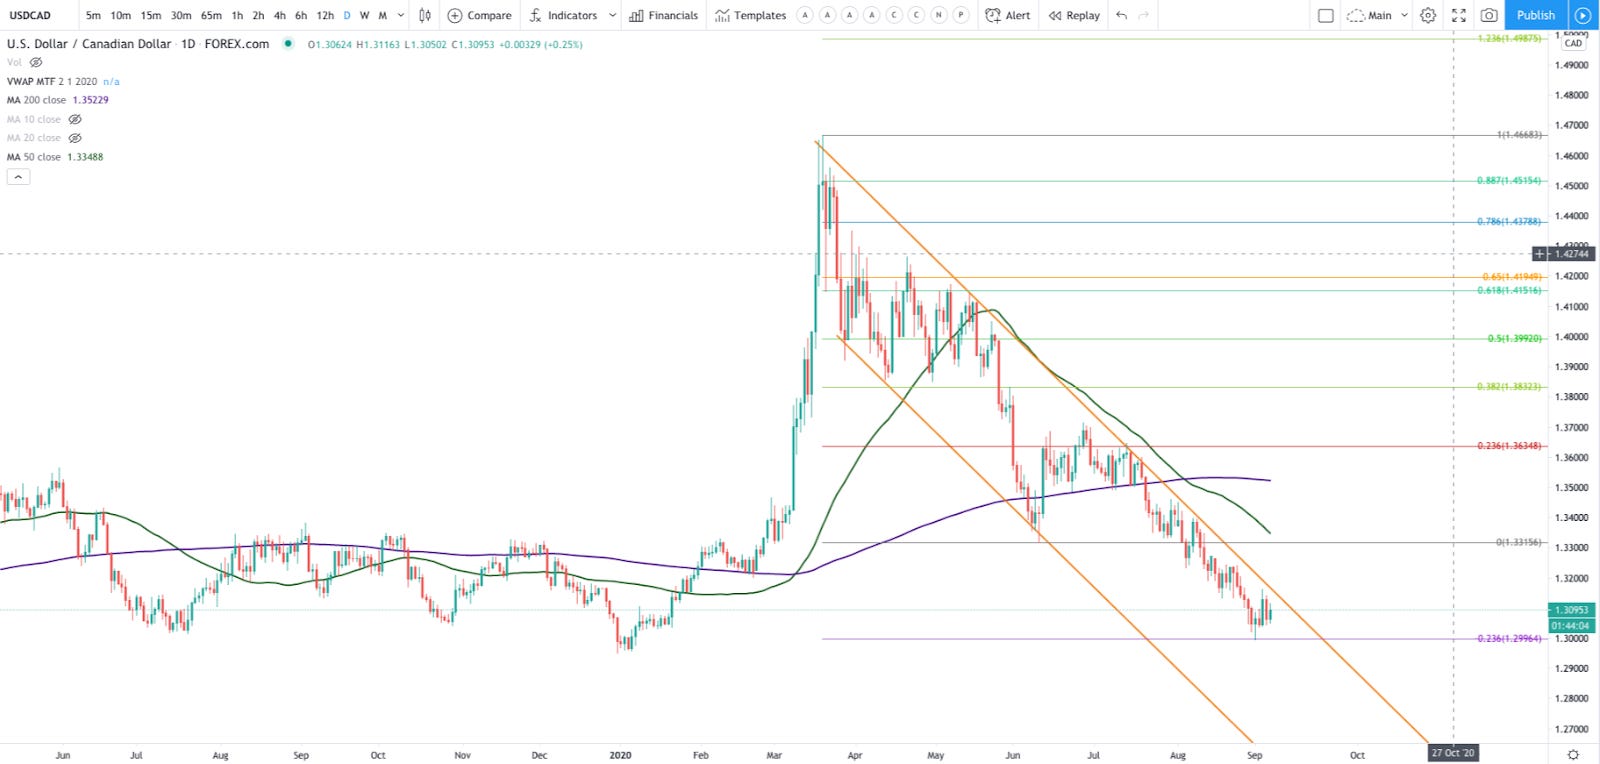
USDCAD continues the downward path inside this channel. Buyers were found a significant fib level. I think USDCAD will show strength this coming week and maybe test the green 50 DMA.
US Dollar Currency Index (DXY)

The USD found buyers at the .236 fib retracement from the 2016 highs to the 2018 lows. We may get a bounce here and let the 50 DMA catch up.
BITCOIN (BTC)

Last week’s candle is pretty ugly, however, the price is still above our weekly moving averages. BTC needs to hold 10K; however, I can also see a throwback to test the trendline and previous support in the 9200 levels.
WHEAT FUTURES (ZW1!)

I like this consolidation inside the ascending triangle. We have had our eyes on this one since April anticipating a triangle breakout. If the price can get above the ascending triangle, then I have a price target at 736’6.
SOYBEAN FUTURES (ZS1!)

This breakout above the trendline from 2012 is exceptionally bullish. I expect a throwback to retest the trendline and then further continuation to the upside. The price is also back above the 200- week MA. BULLISH
CANOLA NOV ’20 FUTURES (RSX20)

The weekly chart of Canola. A rising 30-, 40- and 50- week moving average is promising. Price broke out above the 200- week moving average and the trendline from 2008. This is bullish.
TLT vs SPY RATIO
(ISHARES 20+ YEAR TREASURY BOND ETF vs SPDR S&P 500 ETF TRUST)

The TLT/SPY ratio is still in a downtrend and below the 200 DMA. However, the ratio has recently broken out above the trendline from the high. If this rises, the SPY is likely to decrease.
FACEBOOK (FB: NASDAQ)
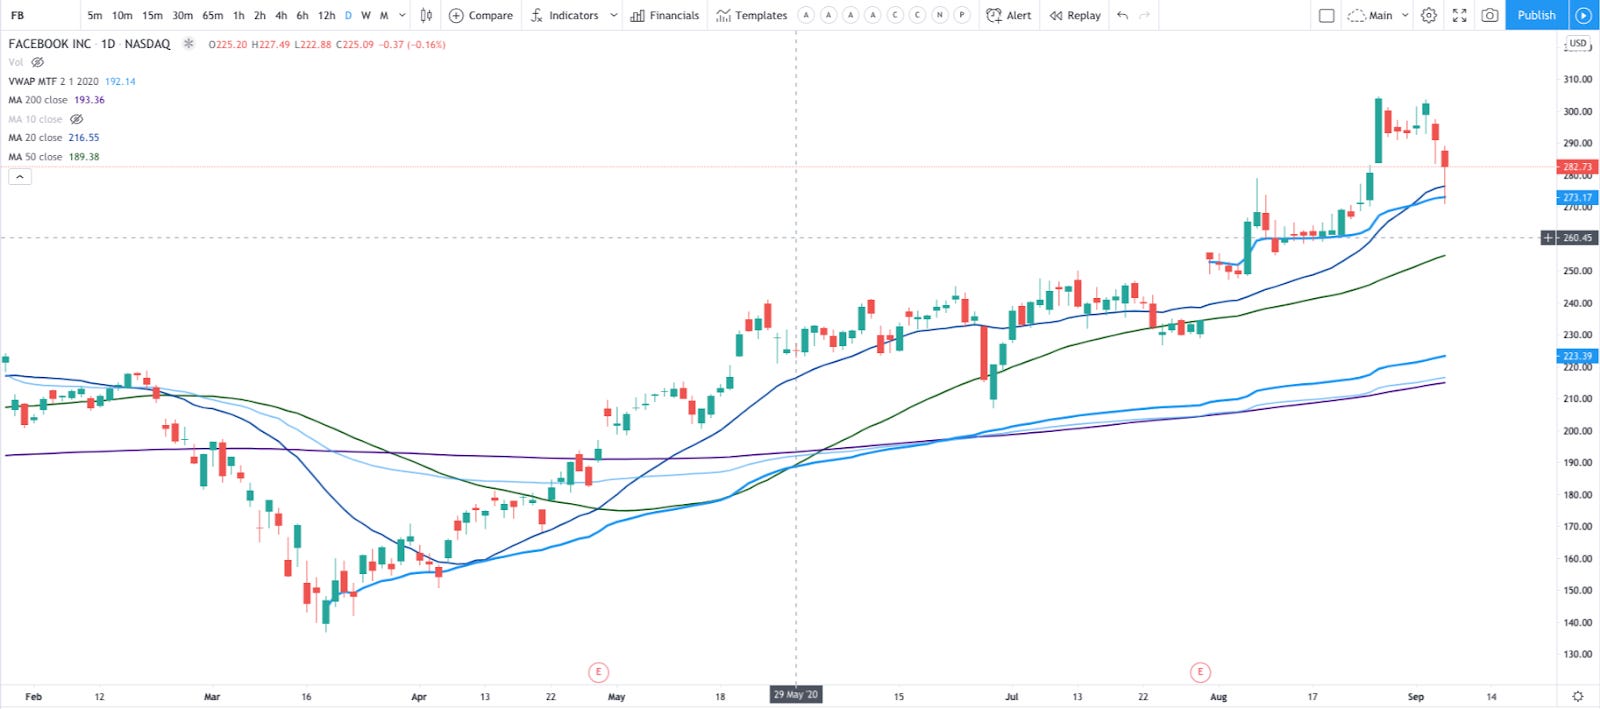
FB has had a couple of bad days before finding buyers at the VWAP from the July 31st gap.
AMAZON (AMZN: NASDAQ)

AMZN retraced hard before finding buyers at the confluence of the 50 DMA and the VWAP from the July 31 move.
APPLE (AAPL: NASDAQ)

Apple closed down 13% from its ATH. If you are a holder, be cautious, this stock can go a lot lower in a lot less time than you can imagine.
MICROSOFT (NFLX: NASDAQ)

This one is for you math geeks. MSFT ATH is at the 3.168 Fibonacci extension from IPO. This one can go a lot higher; however this is a level where I expect it to slow down and consolidate and perhaps experience a significant retrace.
NETFLIX (NFLX: NASDAQ)

I think Netflix could have one more leg down. If it does, pay attention to how it responds to the third test of the red support line at 466.55 as it gets weaker with each test.
ALPHABET (GOOG: NASDAQ)

This weekly chart using a Fibonacci extension suggests that GOOG can still go higher to 1759.
INVESTOR CLASS IDEAS
Last weeks price action has me extra cautious so no Investor Class Ideas this week.
I will post in the Telegram Channel as Trade Ideas develop and are identified during the week.
Here is the link: https://t.me/klarenbachresearch
REMEMBER, CASH IS A POSITION
Don’t FOMO into a position. Have a plan.
Here are the results of our Investor Class Ideas. We were doing well at the start of last week, with each position up 9% before those gains got wiped out in two days.
This is an example of why I prefer Swing Trading over Position/Investing. Our swing trades exited before the more massive drawdown resulting in profits.

CGEN (COMPUGEN : NASDAQ)

We had raised our stop, which was hit and stopped out at 15.94.
SPS COMMERCE (SPSC : NASDAQ)
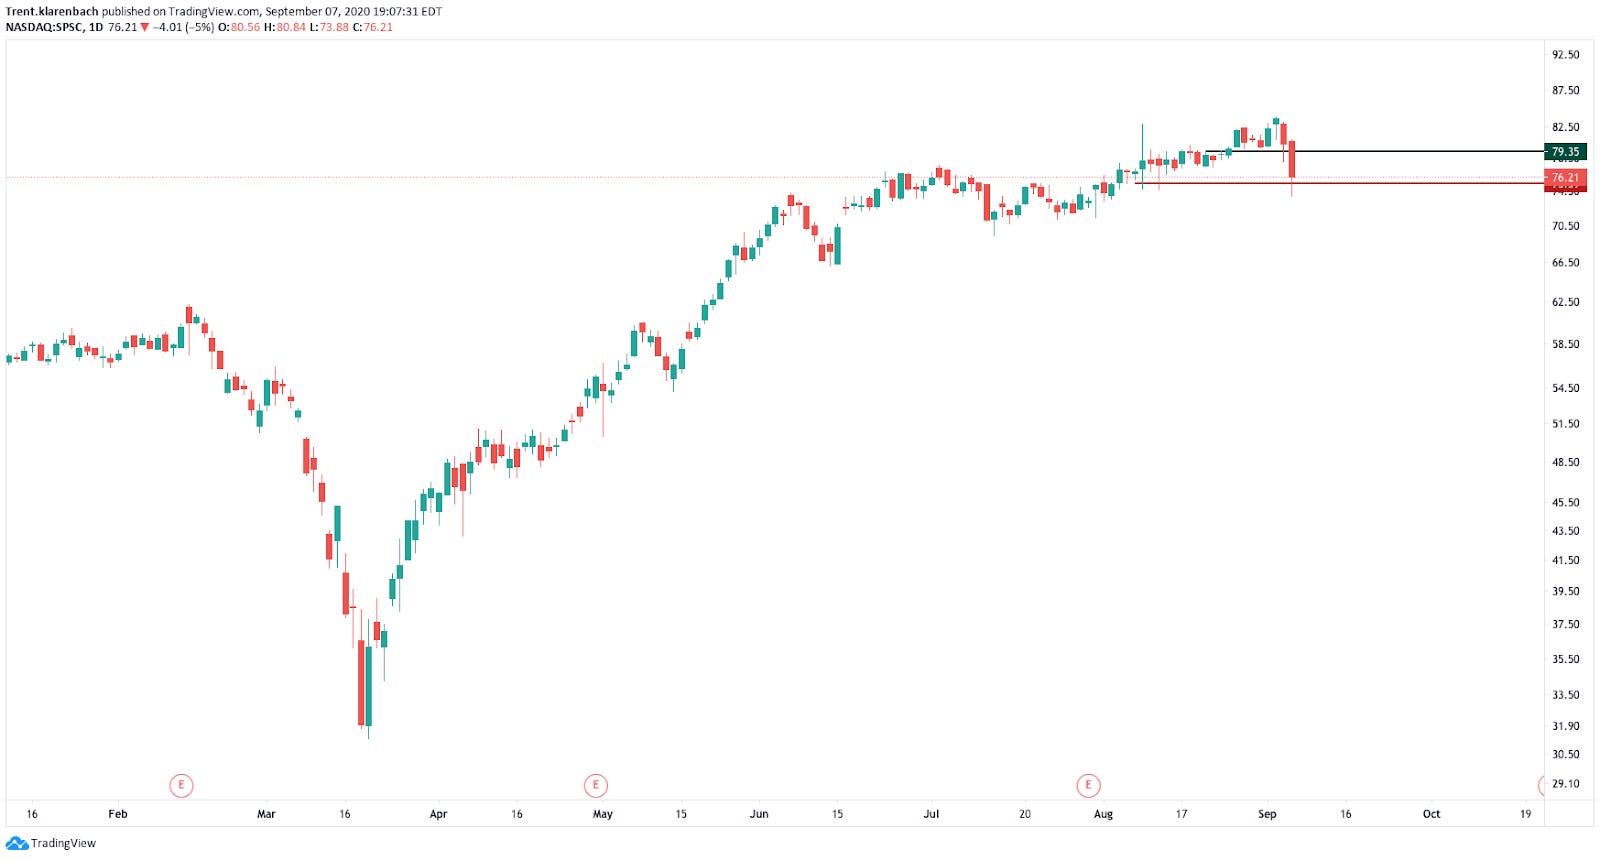
Our stop was raised to breakeven at 75.39, which was hit.
MERIT MEDICAL SYSTEMS (MMSI : NASDAQ)

This triggered, and we moved our stop from 41.33 to 46.98. We are currently +3.9%
NANOSTRING TECHNOLOGIES (NSTG : NASDAQ)

NSTG had triggered above 38.33. We raised our initial stop from 32.69 to 38.37, which stopped out for 1.46% loss.
SWING TRADE IDEAS
Swing trades will be posted as they are identified in the Klarenbach Research Telegram Channel.
We have been active in the Telegram Channel with impressive results.
Here is the link: https://t.me/klarenbachresearch
That is all for now!
Drop me a line with any questions or comments. You can do that here.
I am actively posting charts and ideas on social media.
You can find me here:
Klarenbach Research: klarenbach.ca
Telegram: Klarenbach Research
Twitter: @trentklarenbach
StockTwits: trentklarenbach
Tradingview: trent.klarenbach
I hope you find the FREE Klarenbach Report worthy of your time and choose to hit the subscribe button below.
Please share with anyone else that you think may enjoy it also.
Remember... It is FREE!
Life is Good
This newsletter is sponsored by Mojocial Media.
