


Uncertain Times


Has the market bottomed?
Are we witnessing a dead cat bounce?
Are we headed lower?
These are common questions of which nobody knows the answer.
We can review and analyze the “fundamentals” assuming that we have access to all the information (we don’t) and that we have the time and ability to make heads or tails of it (we don’t).
We could apply technical analysis to review what we know (current and past price action) to get an idea where price can go and how it may get there.
That is what we hope to achieve in The Klarenbach Report.
MARKET REVIEW
S&P 500 Index (SPX)

https://www.tradingview.com/chart/SPX/tFmCL9rR-SPX-Idea/
A big bounce this week has got a lot of people calling the bottom in the market.
Price found resistance at the confluence of the .382 fibonacci level shown on the Day chart and the 200 week moving average (not included in this chart).
If price can break above the .382 fib level and make new highs, then I am looking for an ABC correction with price reaching the green box target minimum of 2773.55.
NASDAQ-100 Index (NDX)

Like the SPX, the NDX found resistance at the .382 fib and support at the .236 fib levels.
The 200 DMA has also started sloping down with a 50 200 Day MA death cross pending.
This death cross has more significance when price is nearby.
This also coincides with my idea of an ABC correction similar to SPX bringing price closer to the death cross.
Dow Jones Industrial Average (DJIA)

https://www.tradingview.com/chart/DJI/2qne4HCp-DJI-IDEA/
DJI is behaving similar to the SPX and NDX.
TSX Composite Index (TSX)

https://www.tradingview.com/chart/TSX/ZHhZrUpz-TSX-Idea/
The TSX is behaving similar to the previous indexes.
S&P 500 Volatility Index (VIX)

The VIX looks like it is in correction mode. If so, can we expect the SPX to continue the bounce?
West Texas Oil (WTIC)

Oil is currently up 30% for the month. Good news for my part of the world.
SPDR Gold Trust (GLD)

GLD is looking strong above the advancing 50 and 200 DMA.
GLD reached the T1 Price Target from my March 14 Tradingview published idea.
You can find it here: https://www.tradingview.com/chart/GLD/NRyxPEpN-GLD-Idea-GLD/
It is a weekly chart and the recent lows are not easily identified on the chart.
US Dollar / Canadian Dollar (USDCAD)
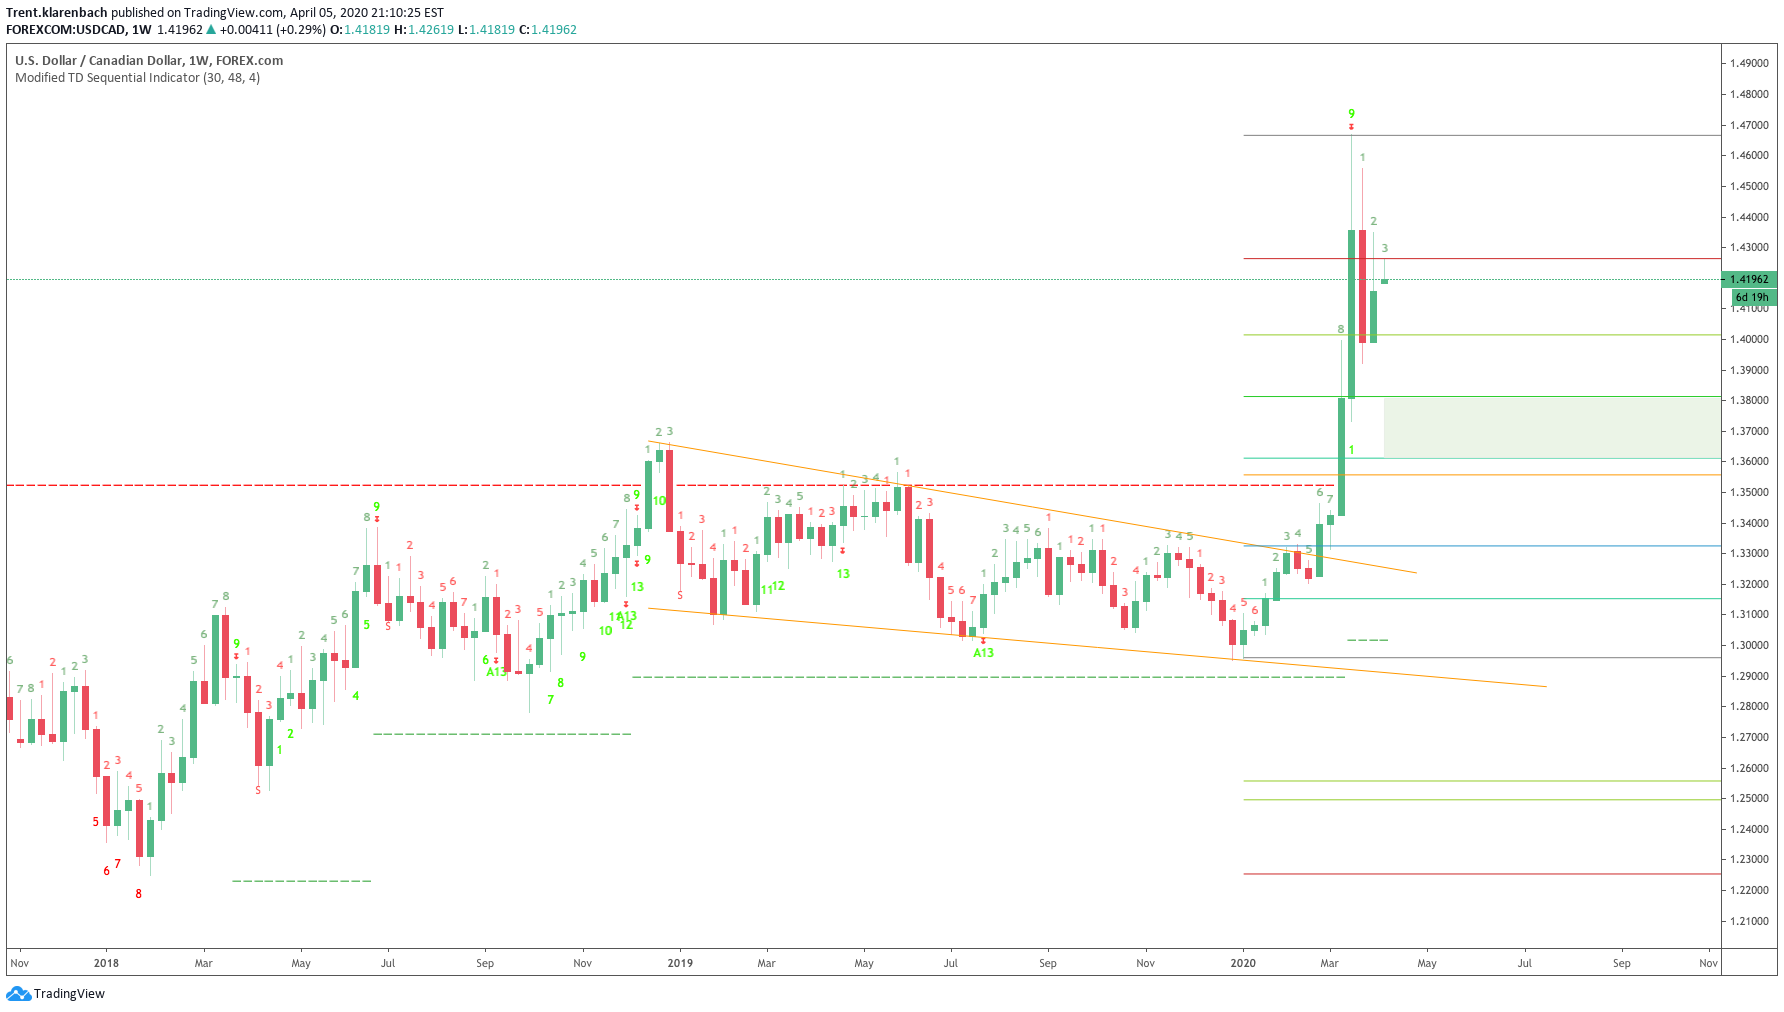
Three weeks ago, a 20 year currency trader brought this one to my attention, stating that the USDCAD pair has only been this strong 0.6% of the time of his career .
Looking at the weekly chart, we could see that the weekly candle was on a TD9 of this version of the Tom Demark Sequential Indicator. This was a good short opportunity.
Looking at the Daily chart, the .236 fib level seems to be acting as resistance. There could be more downside to the .5 fib level.

INVESTOR CLASS IDEAS
The recent fast and powerful move in the markets have resulted in most stocks and ETFs to fail to meet our investor class criteria.
We will continue to monitor for opportunities, however, we will most likely wait for the market to settle down before making a long-term investment.
Since late January, we maintained our long-term investment focus on bonds instead of equities.
We discussed how we arrived at that strategy in a March 29th publication found here: https://klarenbach.substack.com/p/anticipating-a-change-in-market-direction
Let’s look at the iShares 20+ Year Treasury Bond ETF chart.
iShares 20+ Year Treasury Bond ETF (TLT)
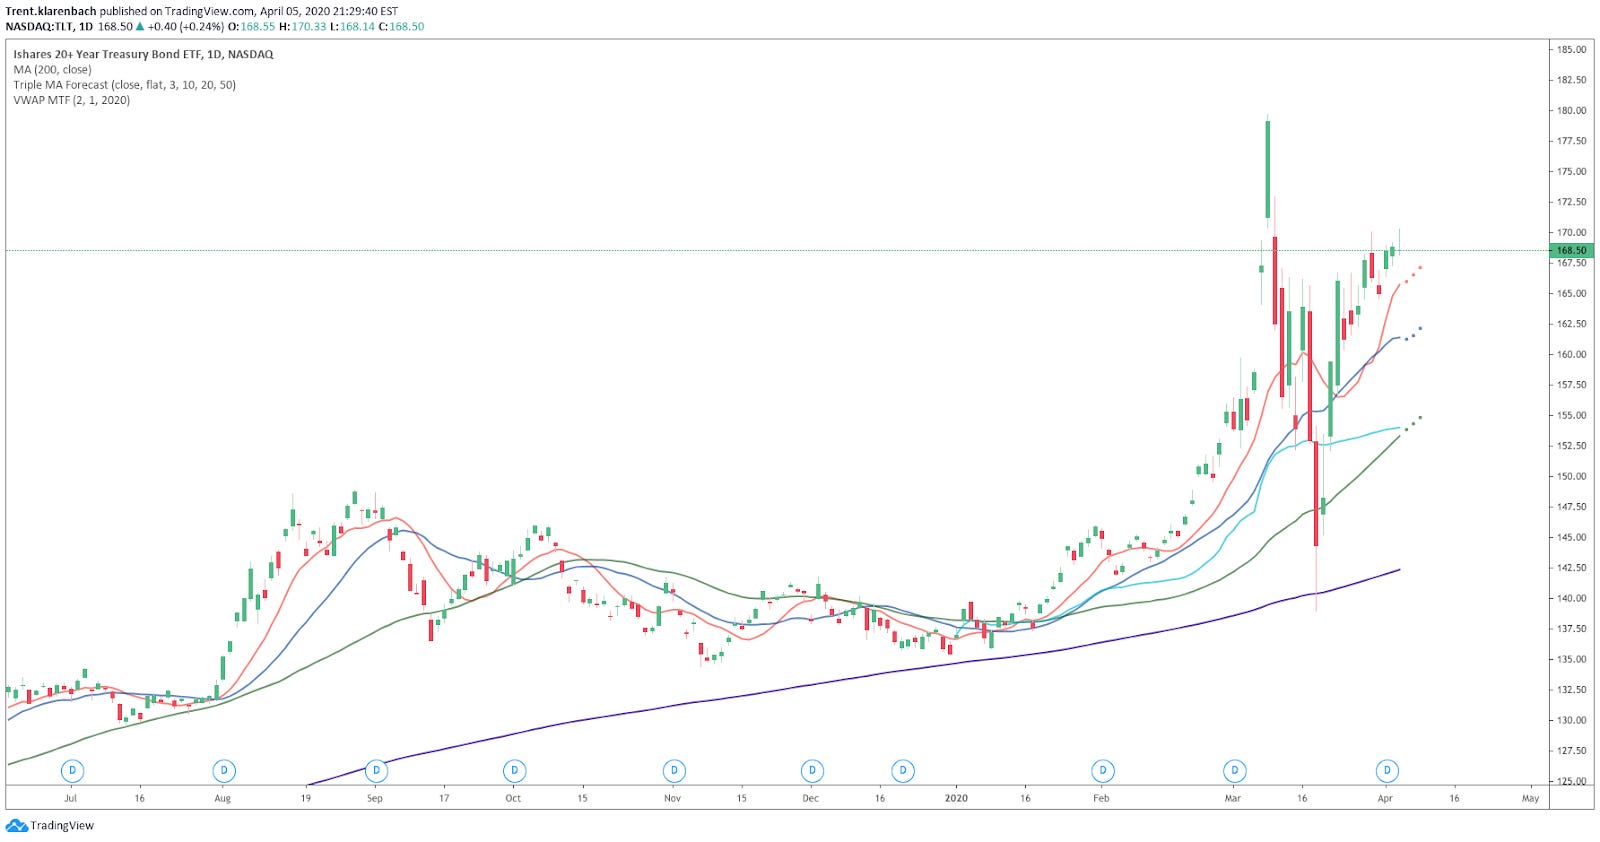
TLT is still pretty strong with price above the YTD VWAP (light blue) in addition to the advancing 10, 20, 50 Day Moving Averages.
TLT is trending higher.
SWING TRADE IDEAS
Before you read any further, remember this:
IT IS OKAY TO BE CONTRARIAN, AS LONG AS YOU DON’T TRY TO BE.
I got that advice from an ex-Investment banker from London.
It is good advice and I believe is relevant to today’s stock market participation.
This week's trade ideas tend to be counter-trend low priced stocks and should be managed with a smaller than normal position size and stops must be honoured.
Don’t fall in love with the trade and do not turn a small loss into a large loss.
BEYOND MEAT (BYND)

https://www.tradingview.com/chart/BYND/ZtNu58sA-BYND-Idea/
We mapped out this price action for a possible ABC correction. Our first B Wave target in the lower green box was reached..
We will be monitoring the price to see if it breaks above 78.60 before we get too excited about the Wave C target.
This a counter-trend trade and should be monitored closely with smaller than normal position size.
APACHE CORP. (APA)
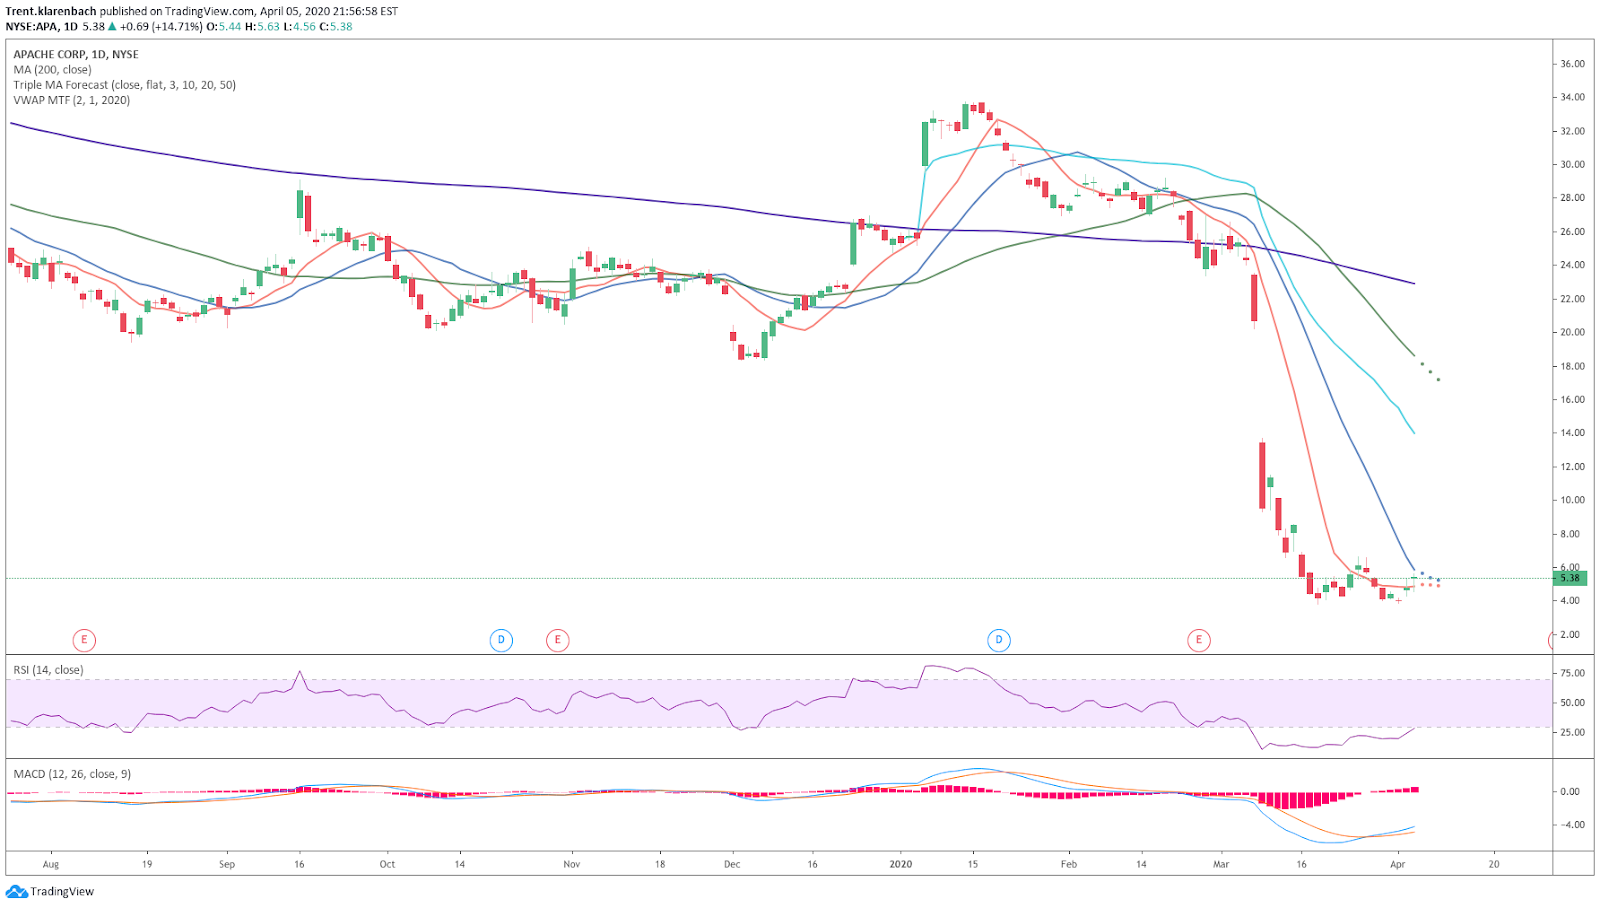
APA looks interesting to me with the consolidation and big price gap.
I will be looking for a long position Monday morning, waiting half an hour after market open before making a decision.
This a counter-trend trade and should be monitored closely with smaller than normal position size.
AURORA CANNABIS (ACB)

I got in a long position last week. I think there is an opportunity here and may add to my position.
This a counter-trend trade and should be monitored closely with smaller than normal position size with a tight stop.
That is all for today.
Follow me on Twitter and StockTwits for other ideas as they are identified.
Drop me a line with any questions or comments. You can do that here
I am actively posting charts and ideas on social media.
You can find me here:
Klarenbach Research: klarenbach.ca
Twitter: @trentklarenbach
StockTwits: trentklarenbach
Tradingview: trent.klarenbach
I hope that you find that the FREE Klarenbach Report is worthy of your time and you choose to hit the subscribe button below.
Please share with anyone else that you think may enjoy it also.
Remember.. It is FREE!
Life is Good