


WEEKLY STOCK MARKET UPDATE

September 26, 2020
The charts hold a lot of information that can be quickly processed and assist with anticipation of future price movements.
I added a few extra charts that can assist in understanding some of the factors in both individual asset price movements and the broad market indices.
I hope to add more of these charts in the future.
Grains continue to look bullish, however, Soy, Wheat and Canola are overextended and last week’s anticipated correction is underway.
I recently began an Introduction to Trading and Investing Workshop that will provide you with the tools and confidence to take control of your investments.
I believe that this workshop will be of great benefit to both new traders and veteran investors. You can sign up on my website with this link: Trading and Investing Workshop.
If no dates are available, reach out to me.
Our free Telegram group, Klarenbach Research, is growing in numbers, and the members are getting more comfortable with asking questions regarding traditional markets and Bitcoin.
We post entries, stops and exits in order that members can learn how to identify low-risk high probability trades.
Some of our members are catching on really quickly and are experiencing success in their trading accounts.
This is where the majority of the ideas are posted.
This is the link https://t.me/klarenbachresearch.
I hope you check it out.
We have had success with our Trade Ideas and the ideas posted on our Telegram Group.
I have included the Trade Results Summary.
The number of trades is becoming too lengthy for this publication.
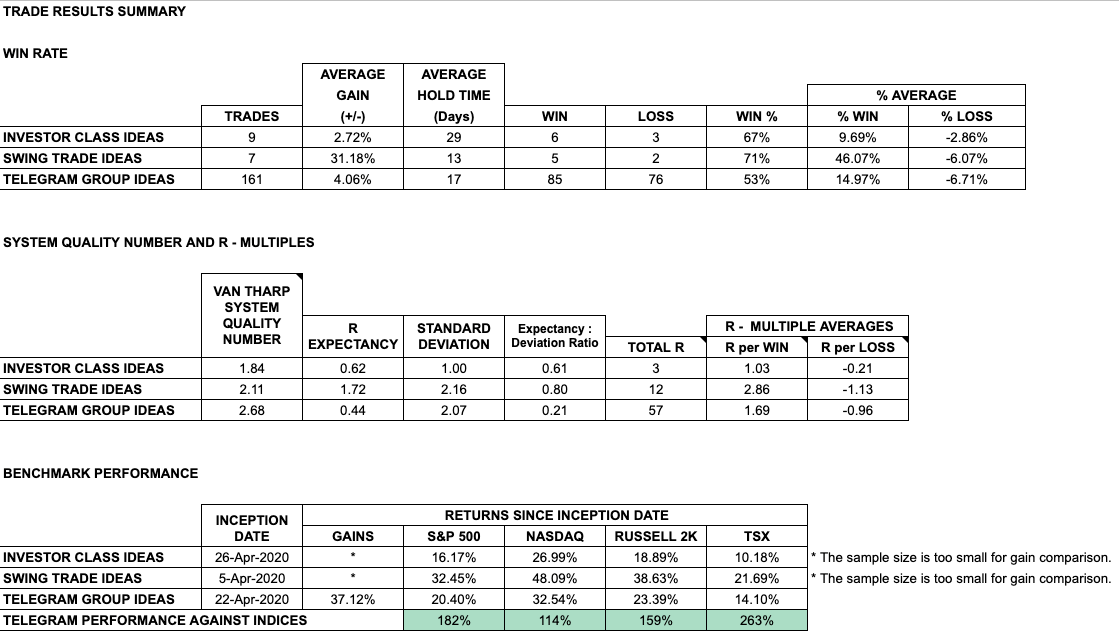
The expectancy of the Telegram Group trades is 4.06% for a 17-day hold.
Extrapolated out to a 30-day month and the result is a 7.2% monthly gain.
I adopted components of Van Tharp’s System Evaluation, which I believe is more effective for system evaluation than win rates and % gains.
MARKET REVIEW
**Click on any chart to enlarge**
SPDR S&P 500 ETF TRUST (SPY)

The SPY found buyers in this red band of previous supply and the light blue VWAP from the May 14 low. The 50 DMA is starting to flatten out and could begin to decline. The price needs to regain the 50 DMA to be bullish.
INVESCO QQQ TRUST NASDAQ 100 ETF (QQQ)
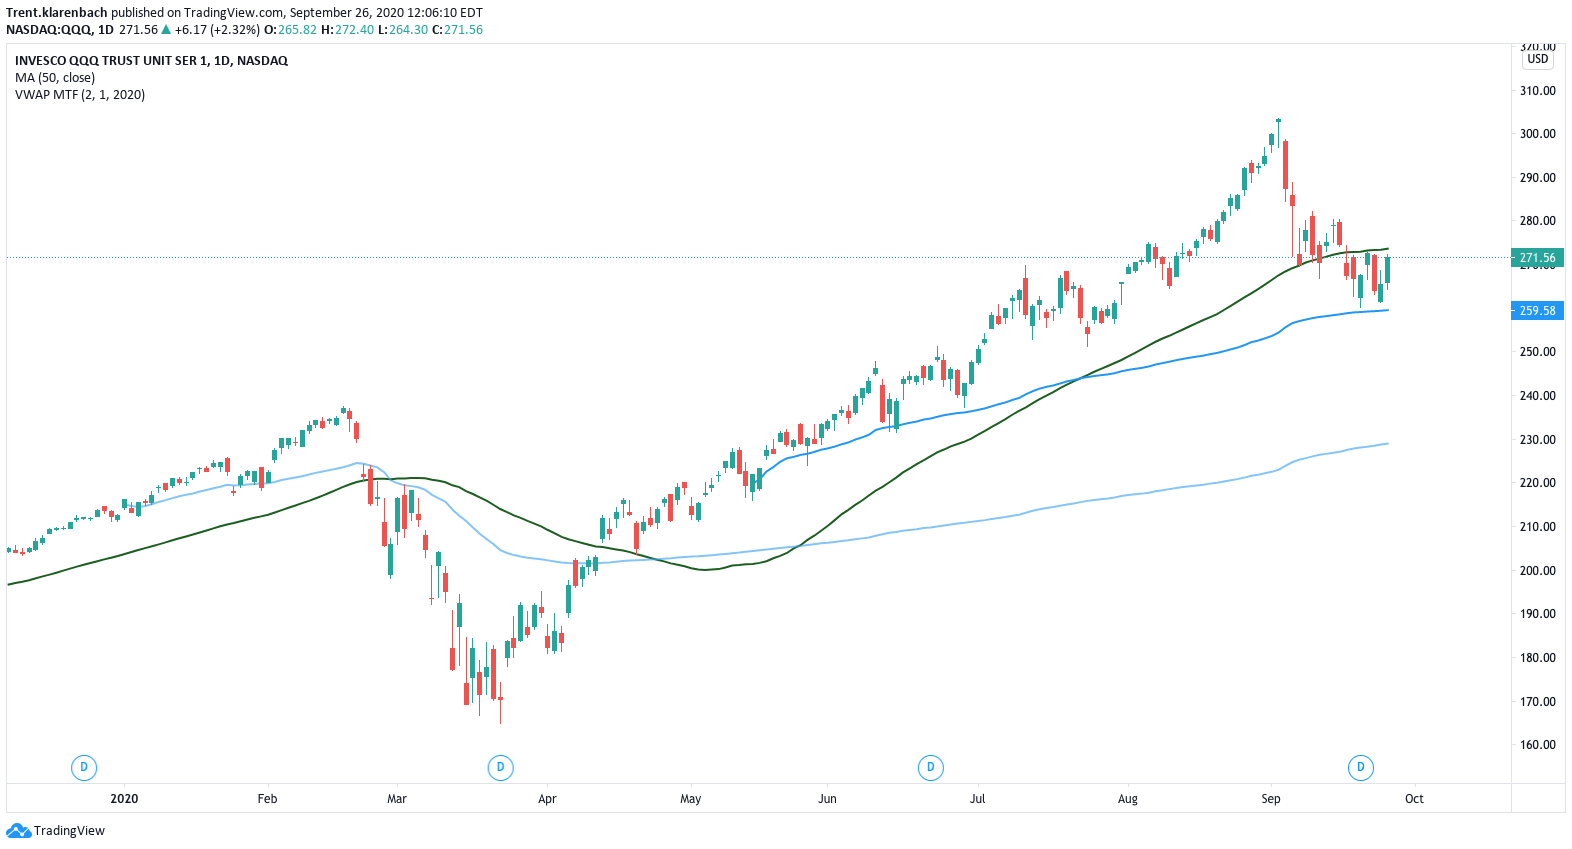
The Q’s found buyers at previous support and the light blue VWAP from the May 14 low.
The price continues to the test to 50 DMA which it needs to regain.
SPDR DOW JONES INDUSTRIAL AVERAGE ETF (DIA)

The DIA broke below the 50 DMA before finding buyers at the VWAP from the May 14 low. Again, the price needs to recapture the flattening 50 DMA.
ISHARES TRUST RUSSELL 2000 ETF (IWM)
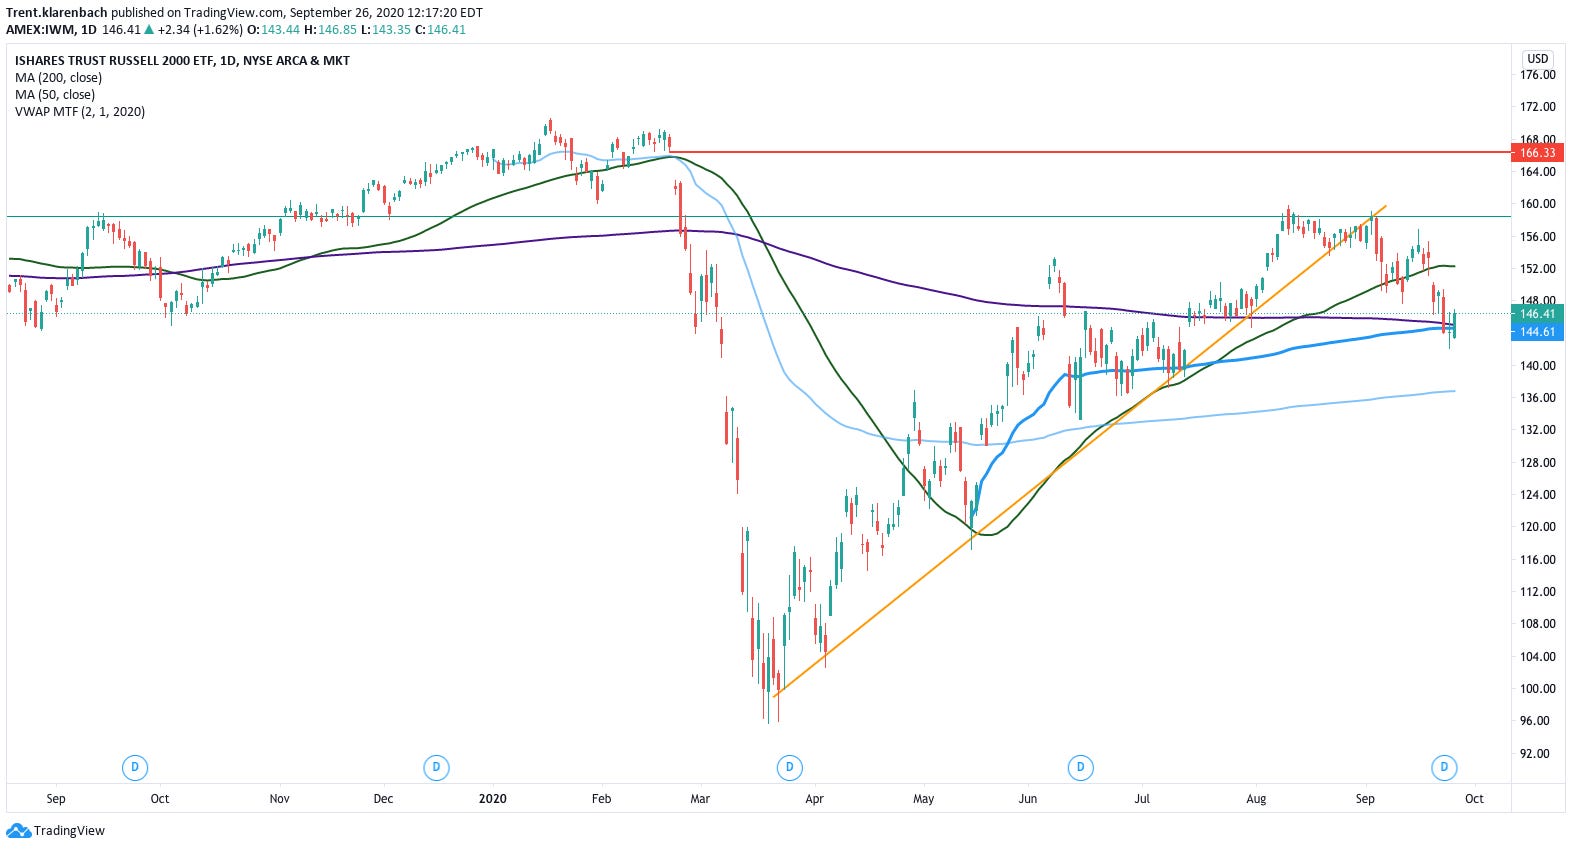
The Russell 2000 found buyers at the confluence of the declining 200 DMA and the VWAP from the May 14 low. Price is below a declining 50 DMA. The 200 DMA needs to hold.
TSX Composite Index (TSX)

The TSX found buyers at the confluence of the declining 200 DMA and the VWAP from the May 14 low. The 50 DMA is starting to decline.
S&P 500 Volatility Index (VIX)

The VIX is bouncing between the advancing 200 DMA and the declining 50 DMA. Maybe this week one of those will break.
The Telegram Group has been watching this breakout above the trendline in anticipating a correction in the S&P 500 for a few weeks now.
West Texas Oil (WTIC)

The price got back above the declining 200 DMA and is fighting with the declining 50 DMA. I expect that WTI is going lower to test the light blue VWAP from the April low.
GOLD Spot (XAUUSD)
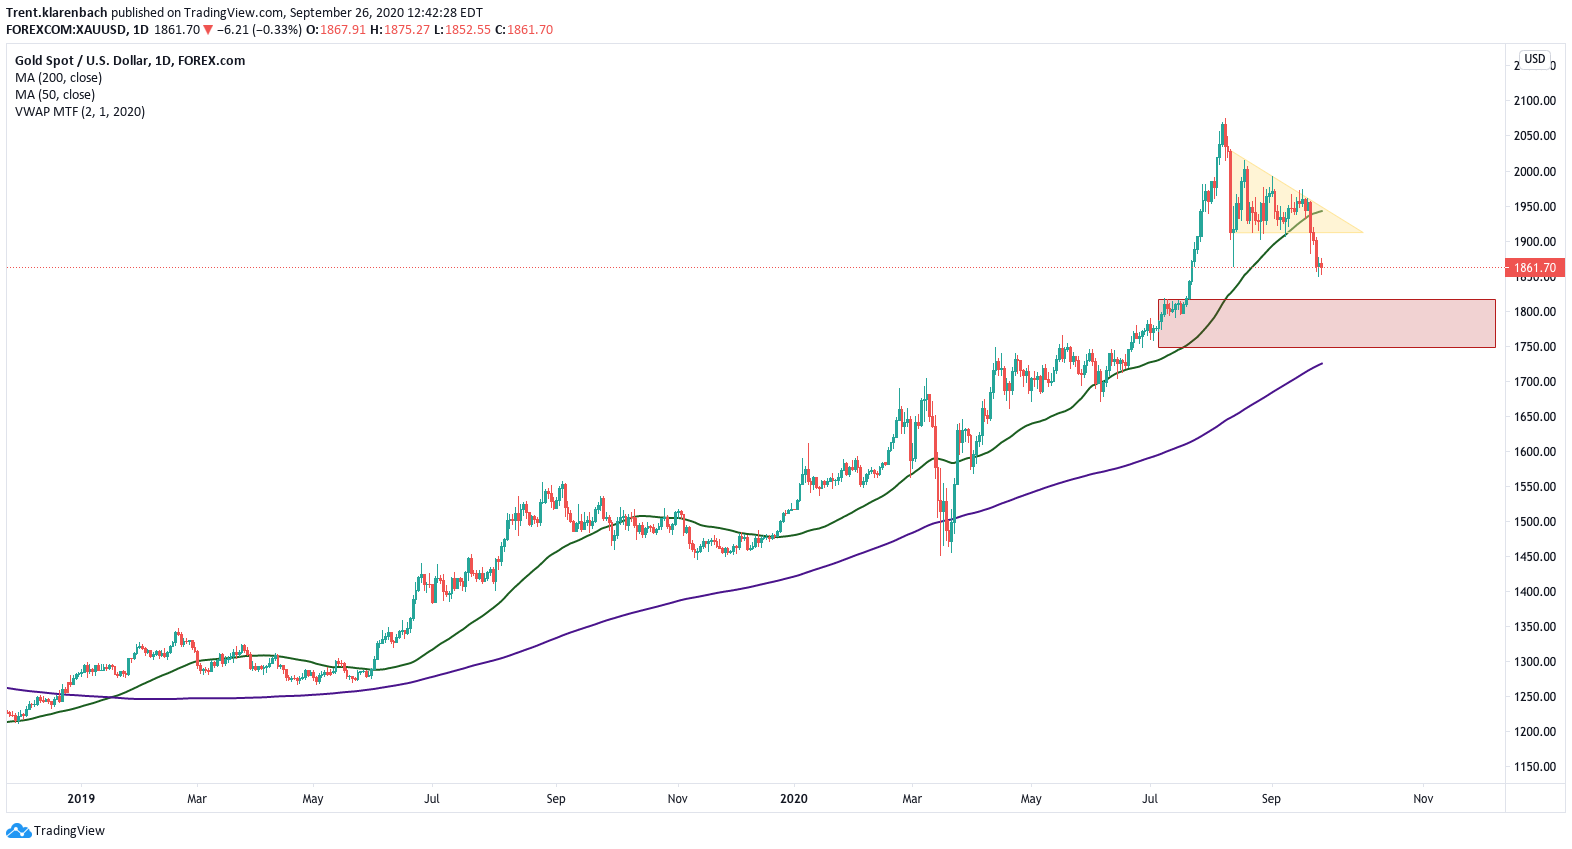
The price broke below the descending triangle as anticipated. I anticipate the price to drop to the red triangle in the 17.50 to 1820 range and then we will reassess.
From last week:
Gold looks weak to me with this descending triangle forming on the Daily chart, however, it is finding support at the 50 DMA.
US Dollar / Canadian Dollar (USDCAD)

USDCAD continues to move higher, blowing through the declining 50 DMA and looks like it will test the 200 DMA.
From last week:
USDCAD broke out of the channel and is poised to move higher. I think USDCAD will show strength this coming week and maybe test the green 50 DMA and 200 DMA
US Dollar Currency Index (DXY)

As we have anticipated, the DXY is attempting to test the yellow trendline.
From last week:
The DXY looks like it will move higher towards the yellow trendline and the weekly moving averages.
BITCOIN (BTC)

BTC seems to be moving in correlation to the SPY again.
This is my Hyperwave chart. I won’t get into the Hyperwave rules, however, it is a fascinating concept.
I adjusted my Phase 7 line to account for the new recent price action.
Hyperwaves occur across all asset classes. Basically, the rules state that unless the Phase 7 line is broken, you can expect prices to retrace to the Phase 1 line. In my chart, that would mean sub $1000 BTC.
Do I think that will happen? No, I am bullish BTC.
Do I think it can happen? Yes
Am I prepared it that happens? Yes
What would be the catalyst? My guess is a worldwide depression and a stock market crash with a flight to USD.
WHEAT FUTURES (ZW1!)

The wheat price experienced a throwback below the upper trendline of the ascending triangle. I still have my price target.
From last week:
We have been stalking this chart since April and the weekly price finally closed above the trendline. If price can spend some time above the ascending triangle, then I have a price target at 736’6.
SOYBEAN FUTURES (ZS1!)

SOY is pretty extended. I expect a correction to the 200 DMA allowing the 50 DMA to catch up before resuming to the upside.
Without thinking about this too much, this chart could be predicting a boom in the vegetarian food market.
This market, in particular, veggie burgers will be to farmers, what the internal combustion engine was to early oil companies.
CANOLA NOV ’20 FUTURES (RSX20)

Price is testing the area of previous resistance which I expect to break. The price extended and I expect it to retrace, maybe test the breakout trendline before much higher. This is bullish. Very Bullish.
TLT vs SPY RATIO
(ISHARES 20+ YEAR TREASURY BOND ETF vs SPDR S&P 500 ETF TRUST)

Keep an eye on this ratio, as it has recently broken out above the trendline from the high. This ratio can be forecast a change in direction and/or movement in the S&P 500.
FACEBOOK (FB: NASDAQ)

FB is still below its 50 DMA and as we anticipated found support at the light blue VWAP from the March low.
AMAZON (AMZN: NASDAQ)

AMZN found buyers at the VWAP from the May low is still below a declining 50 DMA.
APPLE (AAPL: NASDAQ)

Apple found buyers at the VWAP from May 15.. Price is now back above the advancing 50 DMA which is bullish.
MICROSOFT (NFLX: NASDAQ)

MSFT found buyers at the VWAP from the April 13 low. Price is testing the 50 DMA. I see a potential head-and-shoulders pattern forming on this Daily chart. If this forms, then I expect the price to test the 200 DMA in the 180-190 area.
NETFLIX (NFLX: NASDAQ)

NFLX tested the area of previous support for the third time. This time the VWAP from the April 13 move was also at that previous support level. Will it hold? The price is below a declining 50 DMA also. My guess is not.
From the previous newsletter
I think Netflix could have one more leg down. If it does, pay attention to how it responds to the third test of the red support line at 466.55 as it gets weaker with each test.
ALPHABET (GOOG: NASDAQ)
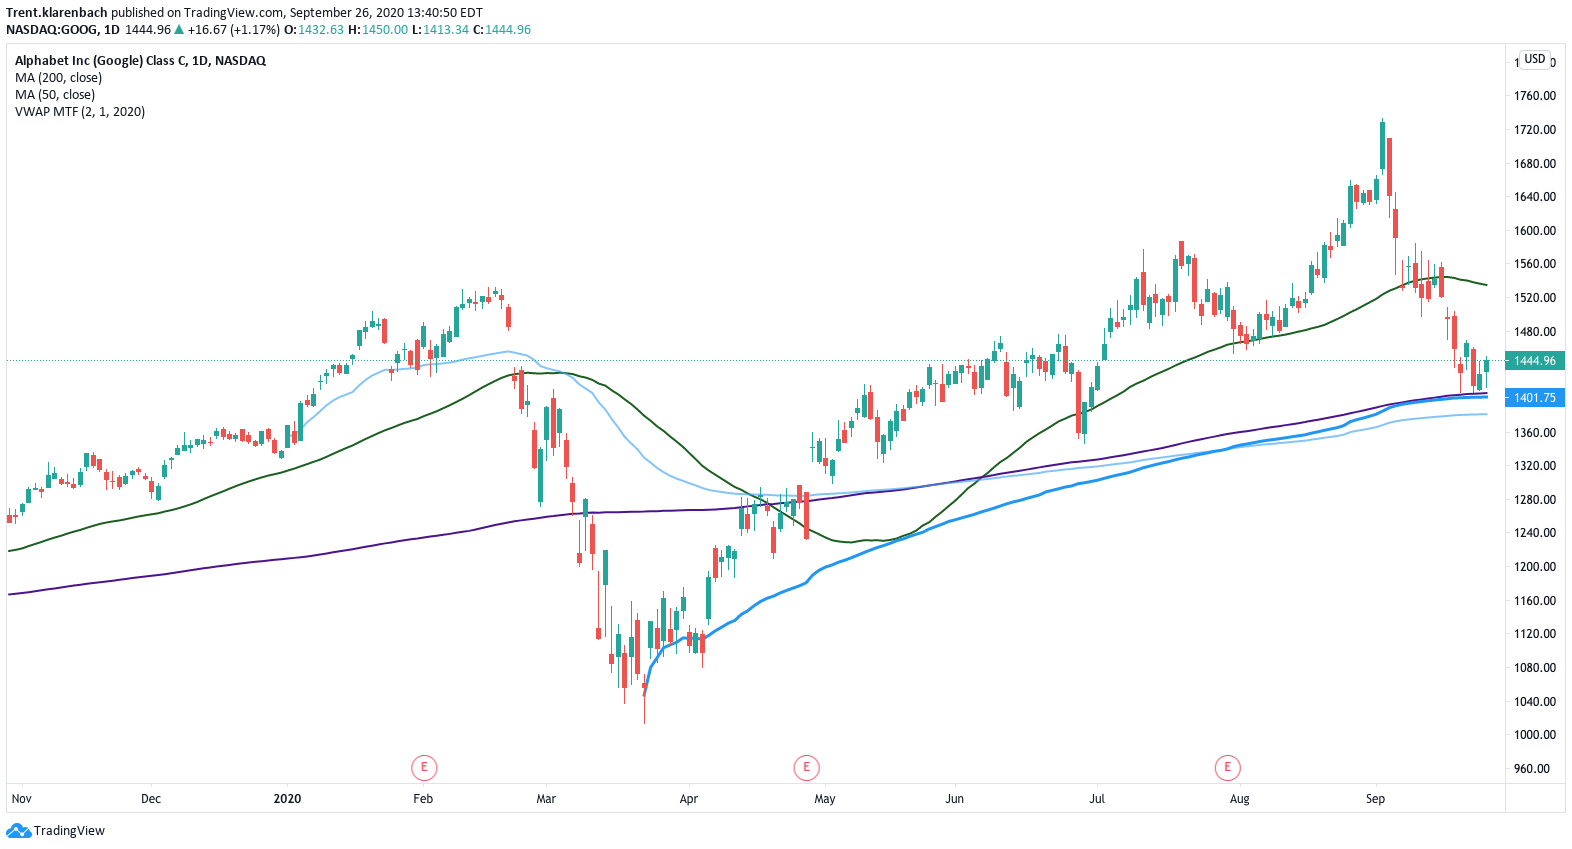
As anticipated, GOOG found buyers at the confluence of the VWAP from the 2020 low and the 200 DMA.
From last week:
GOOG is 15% off its high and below a declining 50 DMA. An area of interest is the confluence of the light blue VWAP from the 2020 low and previous supply.
FAANG STOCKS (FB+AAPL+AMZN+NEFLIX+GOOG)
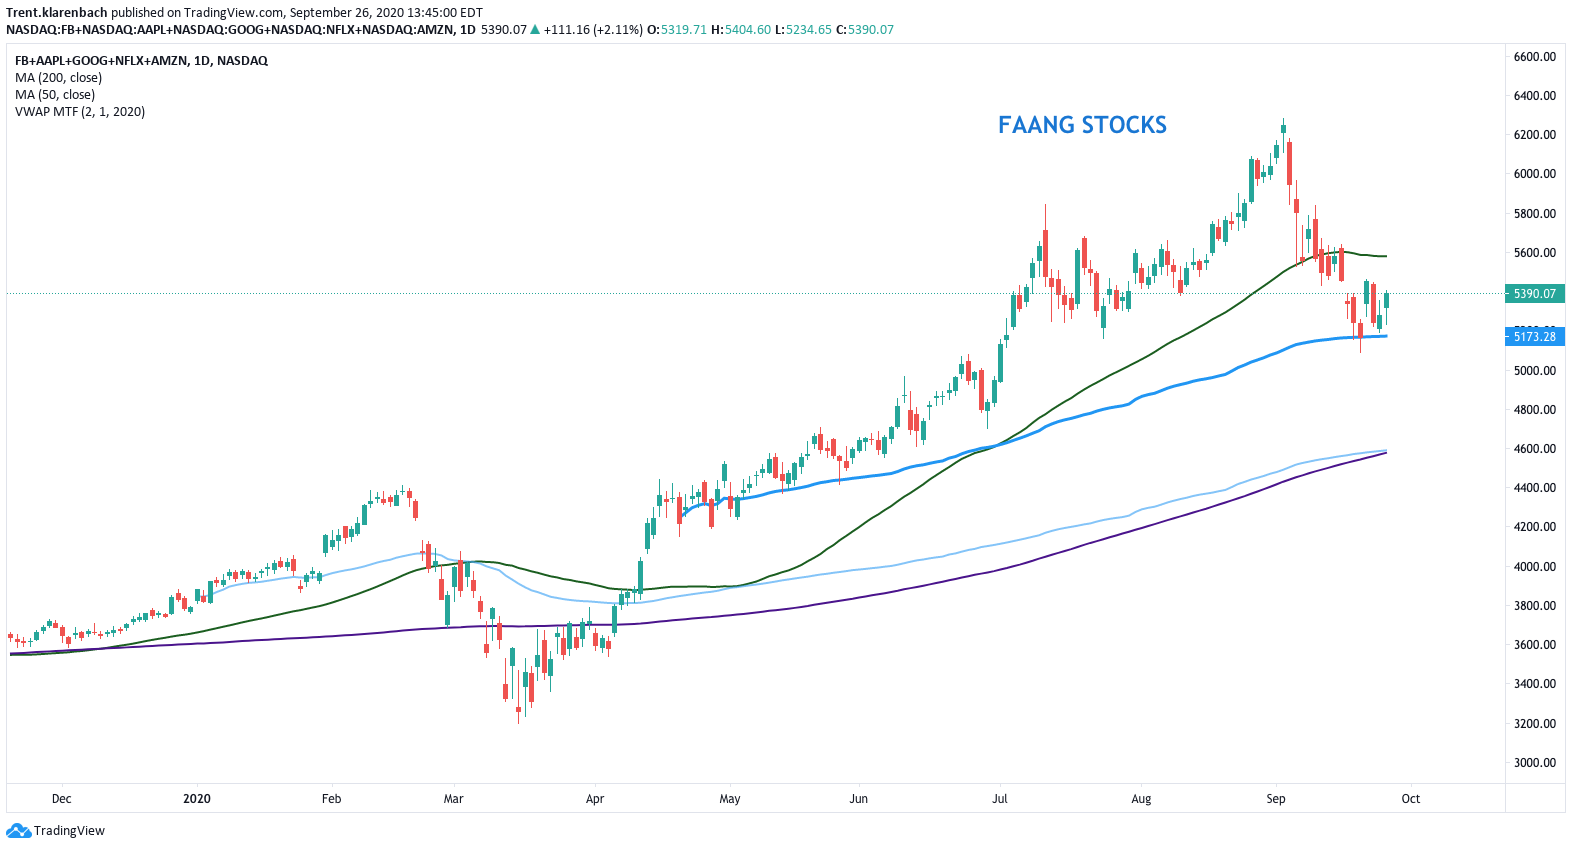
I combined the FAANG stocks into one chart. As you can see, the price is below a declining 50 DMA.
Do you see a potential head-and-shoulders forming?
If it completes, then I can see a 25% decline in this combination to the 200 DMA and YTD VWAP.
The direction that FAANG stocks go has been determining the direction of the broad market indices.
Will that continue? I do no know.
Should we be aware of that correlation? Yes.
USD BTC GOLD SILVER

Pictures can tell a thousand words. What can charts tell?
Notice how the safe havens react when the USD makes a new bottom or top?
INVESTOR CLASS IDEAS
With the uncertainty in the market, we don't have any Investor Class Ideas for this week.
I will post in the Telegram Channel as Trade Ideas develop and are identified during the week.
Here is the link: https://t.me/klarenbachresearch
REMEMBER, CASH IS A POSITION
Don’t FOMO into a position. Have a plan.
SWING TRADE IDEAS
Swing trades will be posted as they are identified in the Klarenbach Research Telegram Channel.
We have been active in the Telegram Channel with impressive results.
Here is the link: https://t.me/klarenbachresearch
That is all for now!
Drop me a line with any questions or comments. You can do that here.
I am actively posting charts and ideas on social media.
You can find me here:
Klarenbach Research: klarenbach.ca
Telegram: Klarenbach Research
Twitter: @trentklarenbach
StockTwits: trentklarenbach
Tradingview: trent.klarenbach
I hope you find the FREE Klarenbach Report worthy of your time and choose to hit the subscribe button below.
Please share with anyone else that you think may enjoy it also.
Remember... It is FREE!
Life is Good
This newsletter is sponsored by Mojocial Media
