Wheat Trade Idea
Trade Ideas for Active Investors

Today, I share my approach to a trade in the CBOT Spring Wheat March 2022 contract.
While you may not be interested in trading futures, keep in mind that this approach is applicable in every market from wheat to FX to bonds, equities, and yes, even cryptocurrencies.
I shared this idea in a farmer discussion forum and initially chose the weekly chart as I assumed that it is applicable to the producer timeframe.
However, I did use the Daily chart for my entry identification using both the recent relevant low and the Anchored VWAP for my initial stop.
They both lined up well on the Weekly, hence the decision to chart that timeframe.
As the trade progresses, I will move to a lower timeframe, ie, Daily or 1-hour, to raise my stop.
The charts below are relatively clean, with the following explanation
The green line signals the price above that I would be interested in a long position.
The red line signals when I believe that I am wrong about the trade and my initial stop would be below this level.
The blue line indicates the VWAP which I considered relative to the chart.
*****Click on the image below to enlarge*****

The trade idea was triggered overnight which I display on the Daily chart below.

Now we are presented with the challenge of maximizing profit while protecting gains.
When and where do we raise our stop?
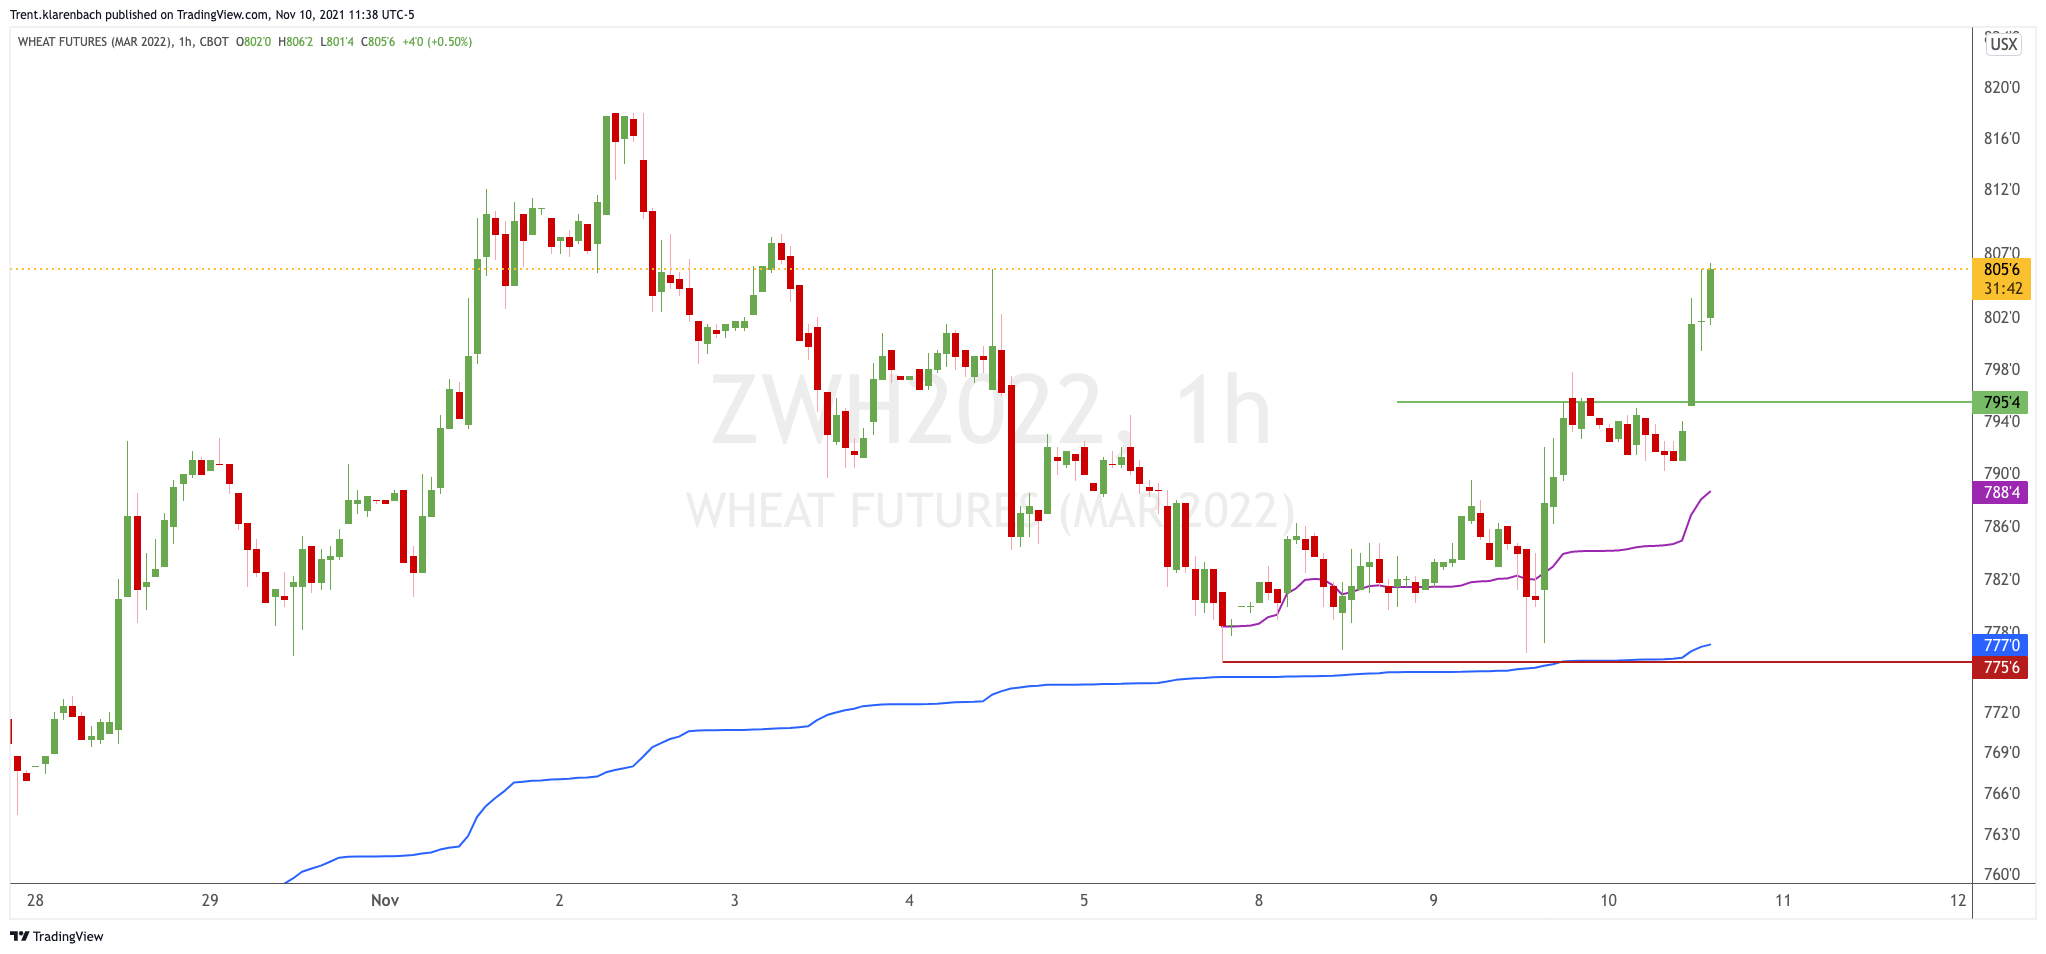
Exploring a lower timeframe using the 1-hr chart below, I added the purple Anchored VWAP from the recent low.
Now it gets tricky,
Does one raise their stop to breakeven, increasing the chance of getting stopped out early and missing a larger move?
Does one retain the same stop for the time being providing more opportunity for this trade to work out?
Does one use a lower timeframe and raise their stop below the purple VWAP?
This is the art of trading where the Mona Lisa can quickly turn into a stick man.