


2021.05.16 Market Review


May 05, 2021
This week I return to a weekly market review.
I hope you enjoy it.
My free Telegram group, Klarenbach Research, is growing in numbers, and the members are getting more comfortable with asking questions regarding traditional markets and Bitcoin.
I post entries, stops and exits in order that members can learn how to identify low-risk high probability trades.
Some of our members are catching on really quickly and are experiencing success in their trading accounts.
This is where the majority of the ideas are posted.
This is the link https://t.me/klarenbachresearch.
I hope you check it out.
MARKET REVIEW
**Click on any chart to enlarge**
SPDR S&P 500 ETF TRUST (SPY)

The early week sell-off found buyers at the green 50 Day Moving Average and Friday’s gains got the price back above the purple VWAP (Volume-Weighted Average Price) from the ATH.
I am bullish as long as the price remains above a rising 50 DMA the VWAP from the high.
INVESCO QQQ TRUST NASDAQ 100 ETF (QQQ)

The NASDAQ has not been as strong as the SPY with an aggressive sell-off in the past two weeks. The price has recovered after spending a few days below the blue YTD VWAP and the purple VWAP from the March low.
I become bullish if the price gets back above the 50 DMA.
SPDR DOW JONES INDUSTRIAL AVERAGE ETF (DIA)

I remain bullish as long as the price remains above the purple VWAP from the ATH.
ISHARES TRUST RUSSELL 2000 ETF (IWM)

The R2K found buyers near the purple VWAP from the March 09, 2020 gap. The price is below the flattening 50 DMA which I consider guilty until proven innocent.
I need the price above the 50 DMA before I get bullish.
TSX Composite Index (TSX)

The TSX found buyers near the 50 DMA and is back above the purple VWAP from the ATH. I am bullish as long as these two conditions are met.
S&P 500 Volatility Index (VIX)

Last week brought a spike in volatility.
Last year’s channel breakout is included for comparison with this year’s price action.
Keep an eye on the VIX.
West Texas Oil (WTIC)

WTI has some overhead supply to work through and this could take some time.
GOLD Spot (XAUUSD)

Gold broke out of the channel on the weekly chart and is now finding sellers at the 50 Week MA. Perhaps the price will slow down, maybe retest the upper trendline.
We are long a number of miners in the Klarenbach Research Telegram Group.
US Dollar / Canadian Dollar (USDCAD)
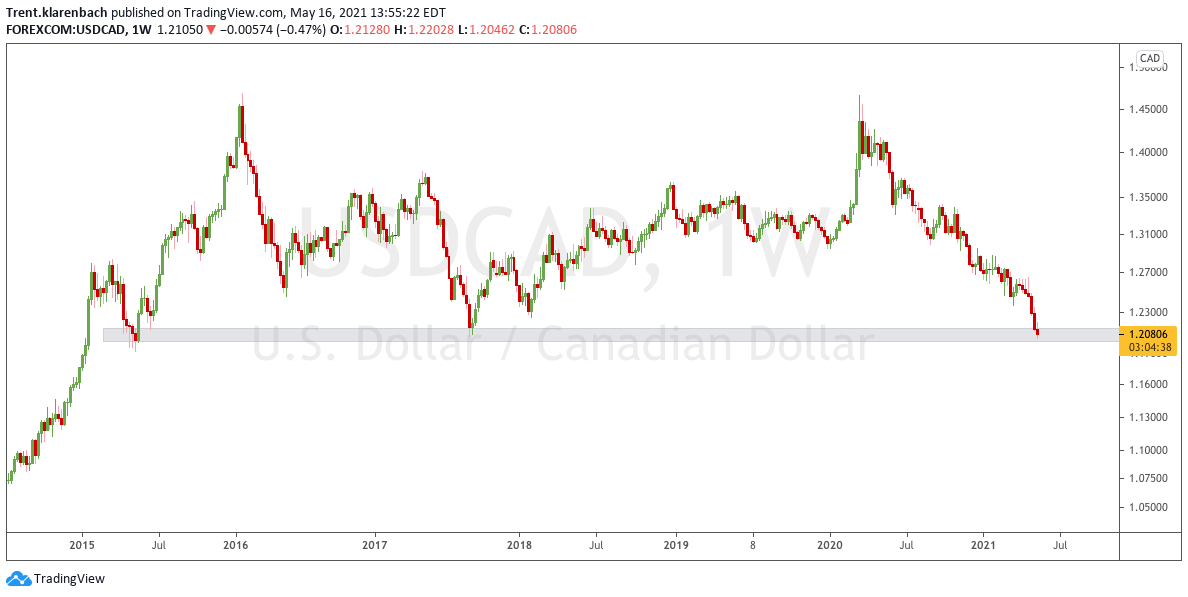
USD has been weak against the CAD since the early days of the pandemic. The ratio is at a level of previous support with not much below it. I can see a bounce here and a break on the next test.
US Dollar Currency Index (DXY)

The price is below a declining 50 Week MA and a 200 Week MA, either of which is bearish on the weekly chart.
I will be watching to see how the blue channel holds.
I keep hearing about a flight to safety in the USD. If it is happening, it is too early to call.
BITCOIN (BTC)

This is a busy chart as I wanted to display some key VWAPs and my Fibonacci levels of interest.
You may remember the April 25 newsletter where I identified two price paths from 51600 to 42000. The first target was hit and is now working on 42K.
Time will tell if 42K is reached.
WHEAT FUTURES (ZW1!)

It is always nice when Technical Analysis works in your favour.
I first started anticipating the ascending triangle breakout in April and May 2020 newsletters. At that time I calculated a measured move price target. This target was hit almost to the tick a few weeks ago.
I anticipate a further pullback and consolidation before trying to make a new highs.
SOYBEAN FUTURES (ZS1!)

We have watched for a break of this trendline since last spring. When it broke, it really broke.
Price found buyers at the .887 fib retracement.
Maybe the price will slow down here.
Notice how the price slowed at the different Fibonacci levels and how these levels were significant in past years.
I cannot explain this phenomenon but I am fascinated by this.
Maybe we live in a simulation?
TLT vs SPY RATIO
(ISHARES 20+ YEAR TREASURY BOND ETF vs SPDR S&P 500 ETF TRUST)
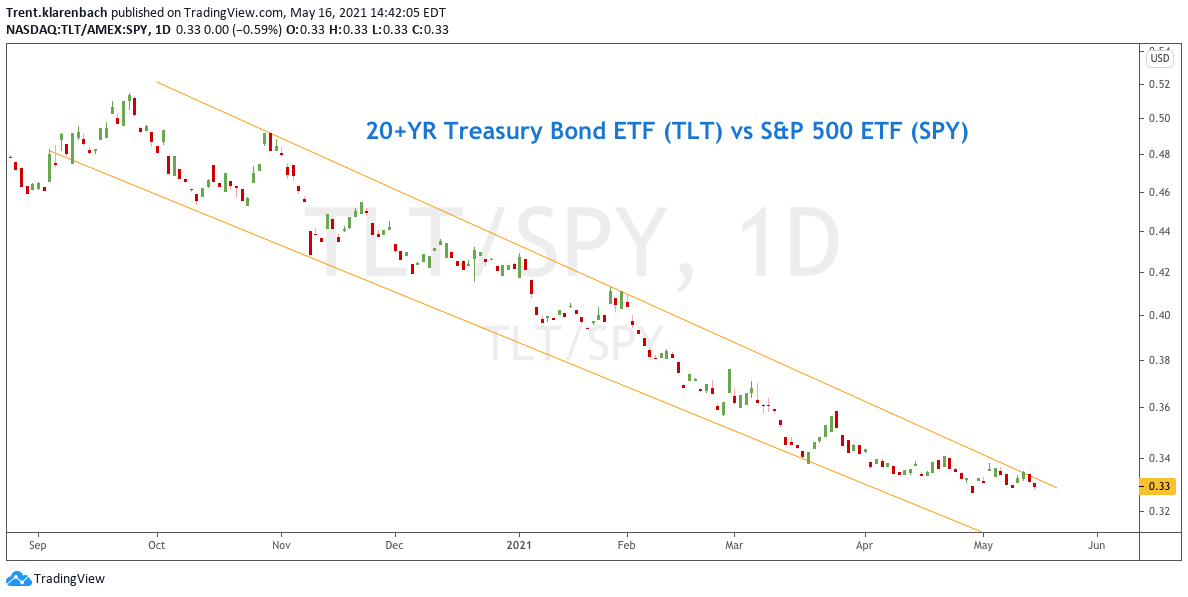
This ratio provides insight into the “smart money “risk sentiment. If capital is flowing into Bonds at a faster rate than the S&P 500 then we assume that we are entering a risk-off environment
This ratio was valuable in avoiding last year’s crash. The same conditions are not present at the moment, however, a break of the upward trendline will get me interested in Bonds.
This ratio can be forecast a change in direction and/or movement in the S&P 500.
SPDR S&P 500 ETF TRUST (SPY)
US DOLLAR CURRENCY INDEX (DXY)
ISHARES 20+ YEAR TREASURY BOND ETF (TLT)
ISHARES TRUST IBOXX USD HIGH YIELD CORPORATE BOND ETF (HYG)

I like comparing the price action of these four charts consisting of the S&P 500, 20+Year Treasury Bonds, the USD and High Yield Corporate Bonds.
HYG can act as an early warning for a drop in the S&P 500, a rise in the USD and a drop in 20+ year treasuries.
BITCOIN CME FUTURES (BTC1!)
US DOLLAR CURRENCY INDEX (DXY)
SILVER FUTURES COMEX (SI1!)
GOLD FUTURES COMEX (GC1!)

I find how the “safe havens” move in relation to the USD fascinating. These charts are valuable in demonstrating something that we probably already “knew”.
Bitcoin is showing weakness against Gold.
Sell your BTC and buy Gold?
If the USD continues to the downside, then I expect the safe havens to rise.
FACEBOOK (FB: NASDAQ)

FB pulled back and found buyers near the 50 DMA.
AMAZON (AMZN: NASDAQ)

AMZN closed the week at the confluence of the blue YTD VWAP, the 50 DMA and the 200 DMA. I need a full candle close above these levels to get bullish AMZN
APPLE (AAPL: NASDAQ)
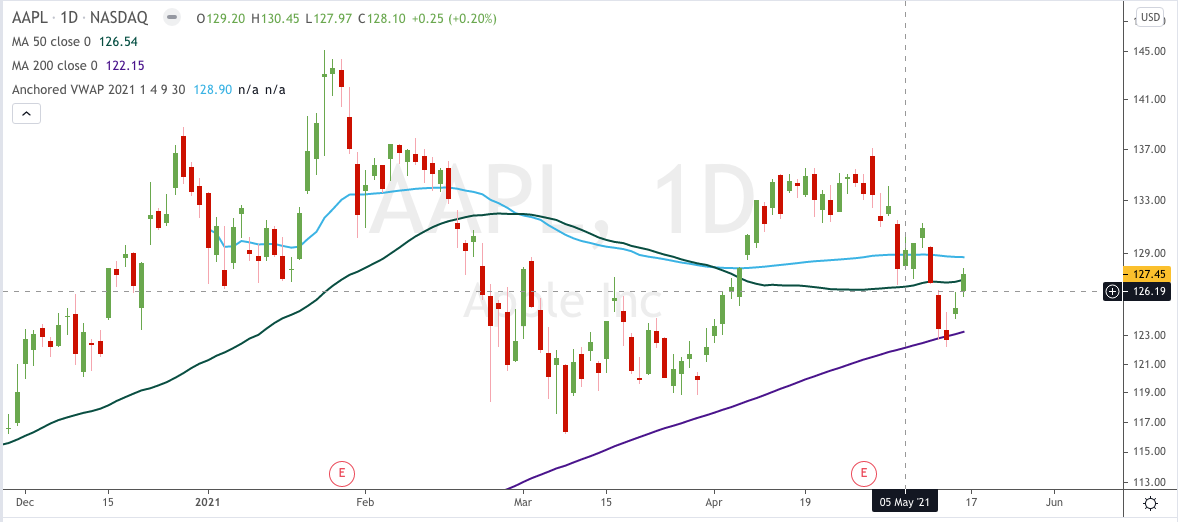
AAPL found buyers at the 200 DMA and closed above a rising 50 DMA. I consider any price above a rising 50 and 200 DMA innocent until proven guilty.
MICROSOFT (MFST: NASDAQ)

Buyers found at the YTD VWAP and closed the week above the rising 50 DMA.
NETFLIX (NFLX: NASDAQ)

NFLX looks rough below the declining 50 DMA and 200 DMA.
A Death Cross with the 50 DMA crossing below the 200 DMA will happen in a few days.
I anticipate the price to rally into the 200 before continuing downward.
ALPHABET (GOOG: NASDAQ)
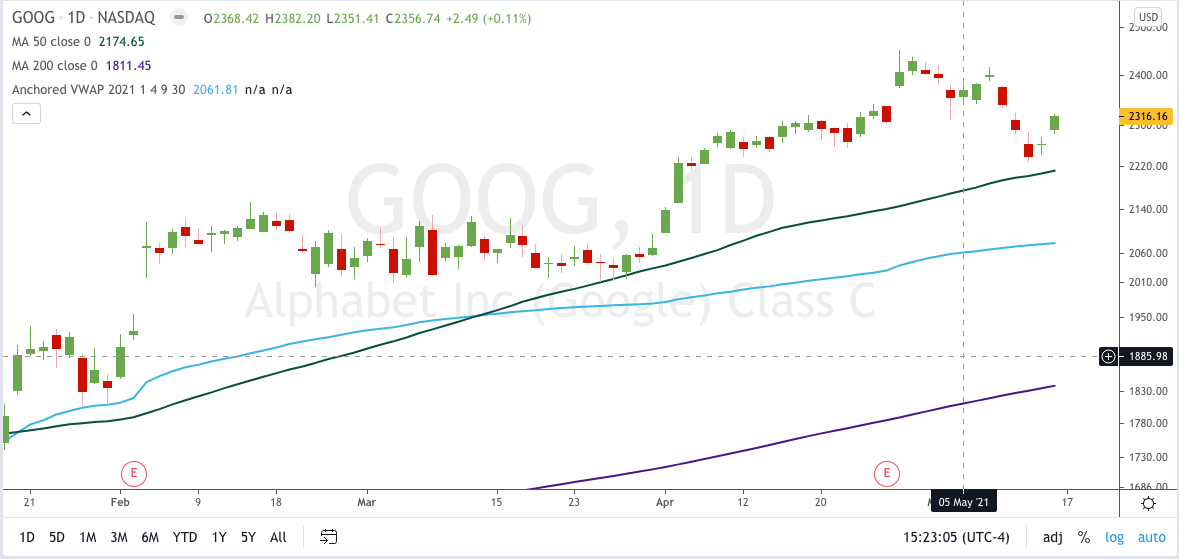
GOOG found buyers near the 50 DMA and remains bullish
FAANG STOCKS (FB+AAPL+AMZN+NEFLIX+GOOG)

I combined the FAANG stocks into one chart. As you can see, the price is above a rising 50 DMA. The group is bullish.
I hope that you find this analysis beneficial and share it with others.
Life is Good
I enjoy discussing the markets, whether they are currencies, equities, commodities, or bonds.
Let’s have a conversation, and we can explore a new perspective of the markets that you can apply to your analysis.
If you enjoy this newsletter, please subscribe below:
Please share the Klarenbach Report with those who would benefit from this resource.
Drop me a line with any questions or comments. You can do that here.
I am actively posting charts and ideas on social media.
You can find me here:
Klarenbach Research: klarenbach.ca
Twitter: @trentklarenbach
StockTwits: trentklarenbach
Telegram Channel: Klarenbach Research
Tradingview: trent.klarenbach