


Big Earnings Week


I started a free Telegram group, Klarenbach Research, https://t.me/klarenbachresearch, where members can post ideas and ask Technical Analysis related stock market questions.
My midweek trade ideas and commentary will also be posted there as execution is quicker than the newsletter.
I hope this group will create a community to share ideas and expand our knowledge of trading and investing.
Telegram is a messaging app with a focus on speed and security, it’s super-fast, simple and free. You can use Telegram on all your devices at the same time — your messages sync seamlessly across any number of your phones, tablets or computers.
This is the link https://t.me/klarenbachresearch.
It is still pretty young, however, we are adding members who are contributing ideas and questions regarding traditional markets and Bitcoin.
I hope you check it out.
MARKET REVIEW
This week there are a number of companies reporting earnings. I suggest that you become aware of the earnings report date for each of your positions. Quite often, the earnings report is followed by volatility which is impossible to predict.
Capital preservation should be your number one goal and the earnings report is a wildcard that is not worth the risk. I never hold my swing trade positions into earnings and very rarely with an investor class position.
Glossary
MA Moving Averages are price based, lagging (or reactive) indicators that display the average price of a security over a set period of time.
DMA Day Moving Average, ie. 5 DMA, 10 DMA, 20 DMA, 50 DMA, 200 DMA
WK Week
VWAP Volume-Weighted Average Price is a measure of the average price at which a stock is traded over the trading horizon. If price is above the VWAP, the average purchase is profitable. If the price is below, the average purchase is losing money. It can be a great measure of sentiment.
YTD Year-to-Date
TD TD Sequential Trading strategy is designed specifically to predict potential price exhaustion and likely price reversals. A TD9 count can, but does not always precede a price reversal.
Fib level Fibonacci sequence level. The Golden Ratio of 1.618 and its inverse, 0.618 are found in nature, architecture, fine art and biology. It is fascinating.
Dead Cat Bounce A dead cat bounce is a small, brief recovery in the price of a declining stock or market.
**Click on any chart to enlarge**
S&P 500 Index (SPX)

https://www.tradingview.com/chart/SPX/tFmCL9rR-SPX-Idea/
Price is still within my green area of interest and is now above the declining 50 DMA. Overhead is the YTD VWAP in light blue and the purple VWAP from the December 24, 2019 low. Quite often these VWAPs act as resistance.
We discussed this level of interest here: https://klarenbach.substack.com/p/uncertain-times
I do expect that price can continue higher to the .618 Fib or the .65 area.
However, I believe that this is a dead cat bounce and will be looking for confirmation to go to cash or to enter short positions.
At this time, I consider the B Wave from my March 26 tweet near completion and am waiting for confirmation of the C wave formation.
SPY (SPDR S&P 500 ETF TRUST)
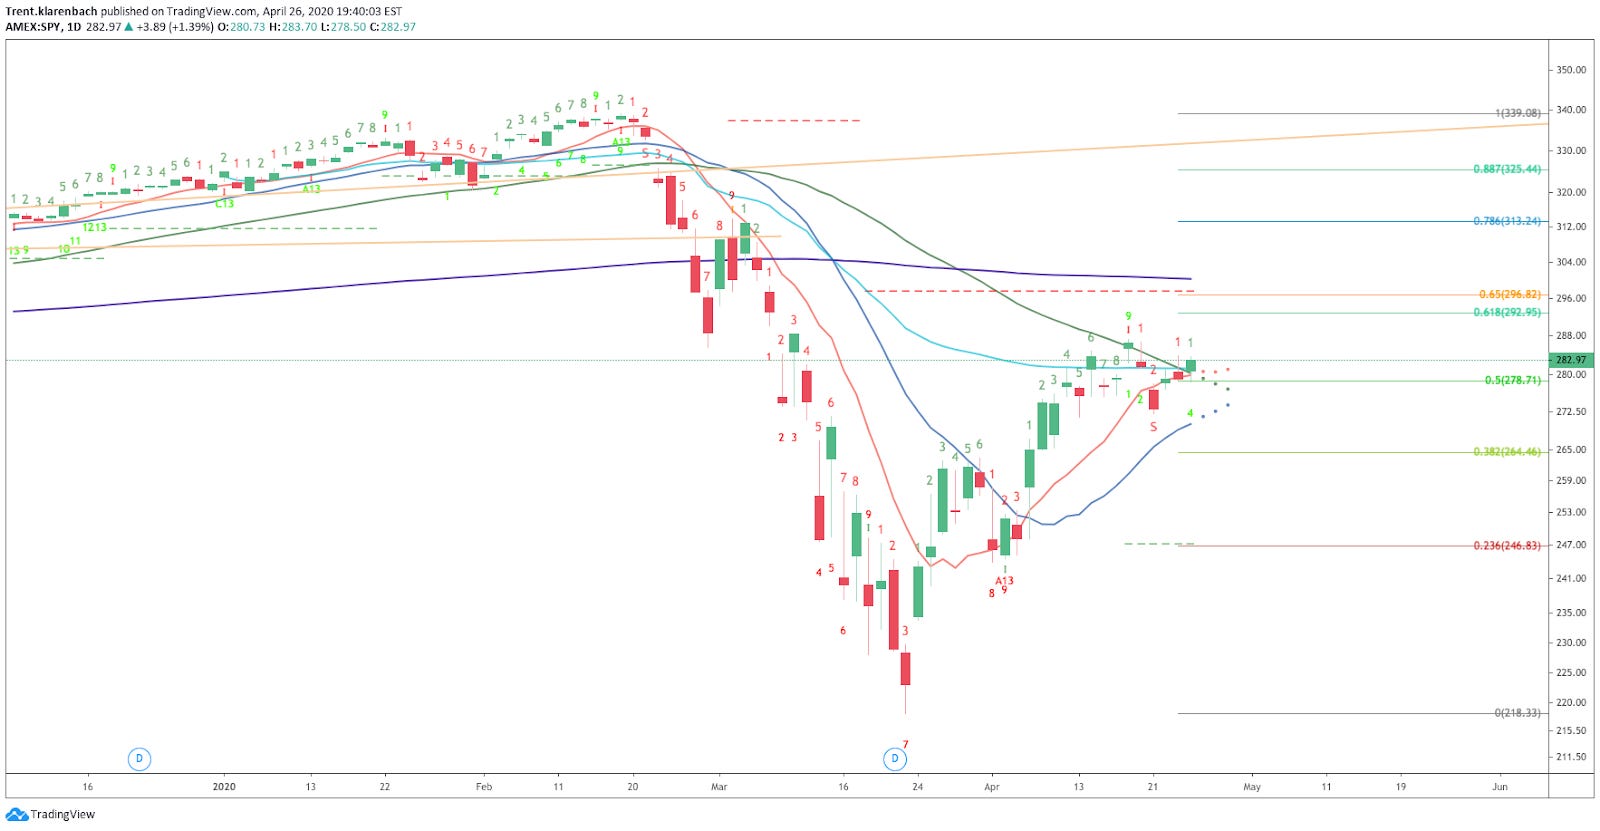
The SPY price closed:
Above the declining green 50 DMA (neutral);
Below the declining purple 200 DMA (bearish);
Below the .618 Fib level (neutral);
Above the light blue YTD VWAP (bullish); and
Closed on a TD1 (bullish).
As long as we are below a declining 200 DMA, I am bearish
NASDAQ-100 Index (NDX)

NDX closed above the .65 fib level showing more strength than the SPX. This is not surprising given the strength of the tech sector. The next fib level of interest in the .786 level.
NDX:
Above the Golden Ratio (0.618 fib level) (bullish)
Above the purple 200 DMA (bullish)
Above the declining green 50 DMA (bullish)
Closed on a green TD1 Candle (bullish)
It is hard to not feel good about the NDX.
Dow Jones Industrial Average (DJIA)

https://www.tradingview.com/chart/DJI/2qne4HCp-DJI-IDEA/
Price is still below the declining 50 DMA and below the .5 fib level
Until I get new information, I think this is a dead cat bounce.
TSX Composite Index (TSX)

https://www.tradingview.com/chart/TSX/ZHhZrUpz-TSX-Idea/
The TSX is lagging behind the previous indexes, however, I think there is still room to move up.
The light blue YTD VWAP and green 50 DMA are just overhead. The move is on declining volume. I expect the move to be limited.
S&P 500 Volatility Index (VIX)

The VIX is lower and closed Friday on a new swing low which could mean the S&P has more upside. Or not.
I am still short VIX so...here’s hoping…..
West Texas Oil (WTIC)

Wild week in the oil markets.
Oil price going negative was devastating to a lot of people and companies, however, the story behind the crash is fascinating. It is an example why you need to understand the futures contract you are trading.
As I mentioned earlier, I kept my long oil stock and option positions over this weekend. It was an interesting time.
As it turns out, the positions closed red on Monday before closing green for the week. Go figure.
From last week’s newsletter,
They are currently profitable and when looking at the contango in the futures market I decided to keep on keepin’ on.
SPDR Gold Trust (GLD)

GLD broke out and is now testing the previous resistance. The gap of the candle bodies did not close, however, the gap of the candle wicks did.
Price is still looking strong above the advancing 50 and 200 DMA.
GLD reached the T1 Price Target from my March 14 TradingView published idea.
You can find it here: https://www.tradingview.com/chart/GLD/NRyxPEpN-GLD-Idea-GLD/
It is a weekly chart and the recent lows are not easily identified on the chart.
US Dollar / Canadian Dollar (USDCAD)

Price broke out and then retested the upper trend line. Price is also above the 10 and 20 DMA
This is bullish.
BITCOIN (BTC)

The S&P 500 advanced as did BTC this past week.
This is a Coinbase chart.
Price is above the YTD VWAP and declining 50 DMA.
This price move is looking more bullish as each day passes, however, we are approaching the apex of the wedge and the 200 DMA.
I don’t trust this move and am currently bearish short- and intermediate term.
The halving occurs next month which is bullish, however, today’s chart tells me otherwise.
I still think that $1000 is on the table, so I will be keeping some powder dry.
I posted the chart below in the Telegram group on Thursday.
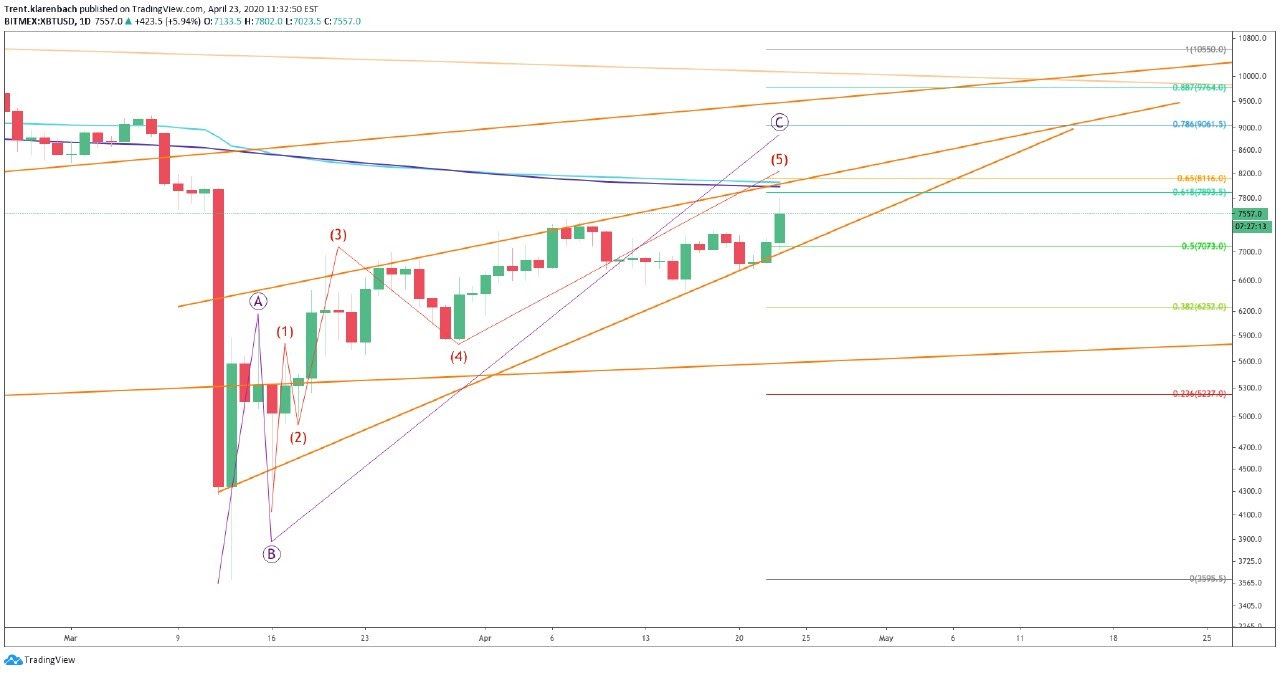
From the Telegram Group:
This is what I am seeing. Confluence of the purple 200 DMA and light blue YTD VWAP and Golden Pocket between 7893 and 8116. I have a rising wedge pattern also. My count is this. Completing Wave 5 of the the corrective C Wave. I also think we are on Wave 4 of a higher degree.
If my Wave 4 is correct, then a Wave 5 sub 3500 is coming. If correct. Subject to change as more information is available. We are also below a declining 200 DMA. We are above the 50 DMA however, it is declining also. Mix in declining volumes (not shown). I consider this move guilty until proven innocent
WHEAT FUTURES (ZW1!)

Wheat closed lower this week.
Price is still above all key moving averages.
I still like this setup.
SOYBEAN FUTURES
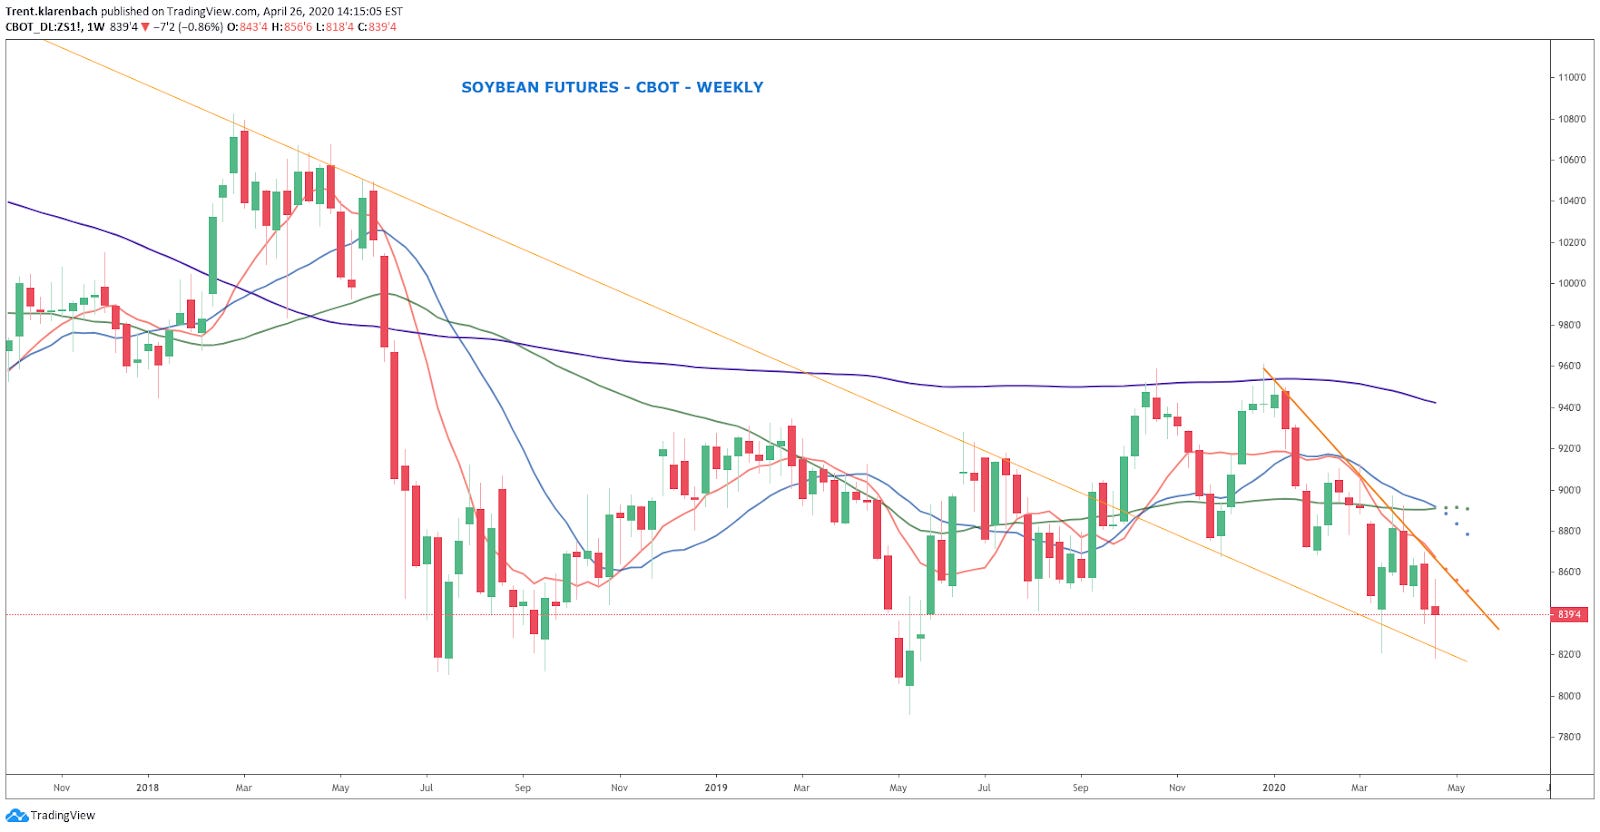
The price closed lower this week and is below key moving averages. However, I do like this closing candle.
INVESTOR CLASS IDEAS
Since late January, we have maintained our long-term investment focus on bonds instead of equities.
We discussed how we arrived at that strategy in a March 29th publication found here: https://klarenbach.substack.com/p/anticipating-a-change-in-market-direction
REMEMBER, CASH IS A POSITION
Let’s take a look at some Investor Class Ideas.
KROGER CO (KR)

KR looks like it is ready to make a move higher. It is above the advancing 10-, 20-, 50- and 200- DMA.
I will wait until the market is open for 30 minutes before looking for an entry above 33.10 with an initial stop below 30.01.
I will update in my Telegram group.
ISHARES 20+ YEAR TREASURY BOND ETF (TLT)

I like TLT above 170.93 with a stop at 163.25 after the first 30 minutes of the market open.
Position size accordingly.
I will update in my Telegram group.
SWING TRADE IDEAS
The big moves of the last couple weeks have made me pretty cautious heading into next week.
I am also expecting a pullback this week and the end of a dead cat bounce.
If I identify any additional ideas during the week, I will post in my Telegram group.
Here is the link: https://t.me/klarenbachresearch
BEYOND MEAT (BYND)

BYND closed the week with some strong moves before finding resistance at the 200 DMA.
In the Telegram group, I raised my stop to 109.35 before getting stopped out 4 minutes later.
The total gain from entry to exit was 39%.
APACHE CORP. (APA)

This is playing out really well.
I will monitoring closely and raising my stops as I think this is ready for a pullback.
APA is up 98% since the idea was published in the April 5 newsletter.
AURORA CANNABIS (ACB)
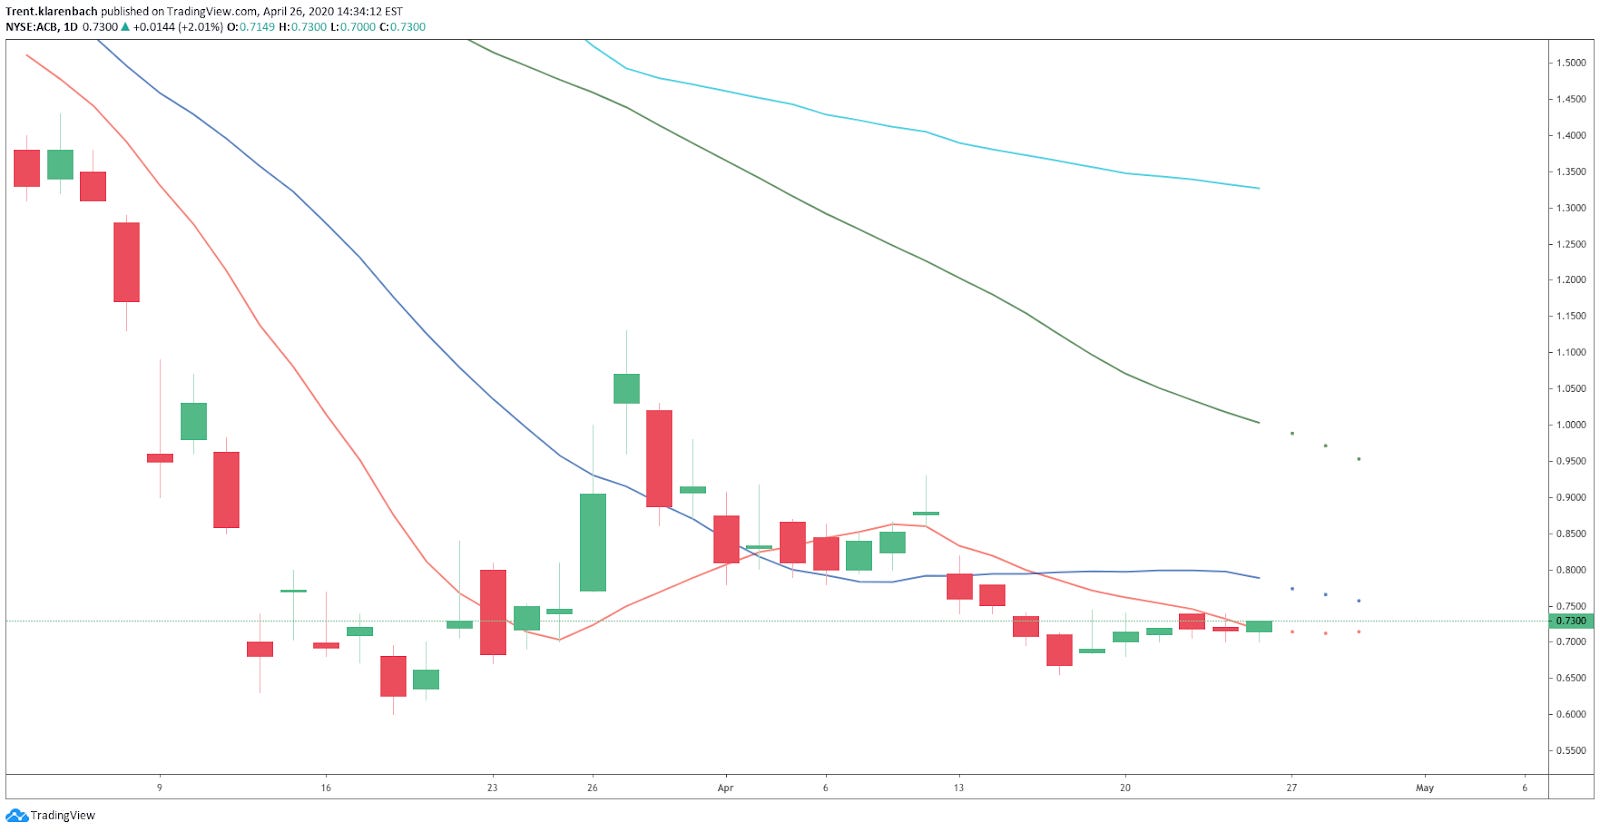
ACB is down 10% since the idea published in the April 5 newsletter.
This is a great lesson in the importance of position sizing and risk management in counter-trend trades.
This is especially important when trading penny stocks where a small moves are large moves.
Hopefully, it will take off this week.
SPDR GOLD TRUST (GLD)
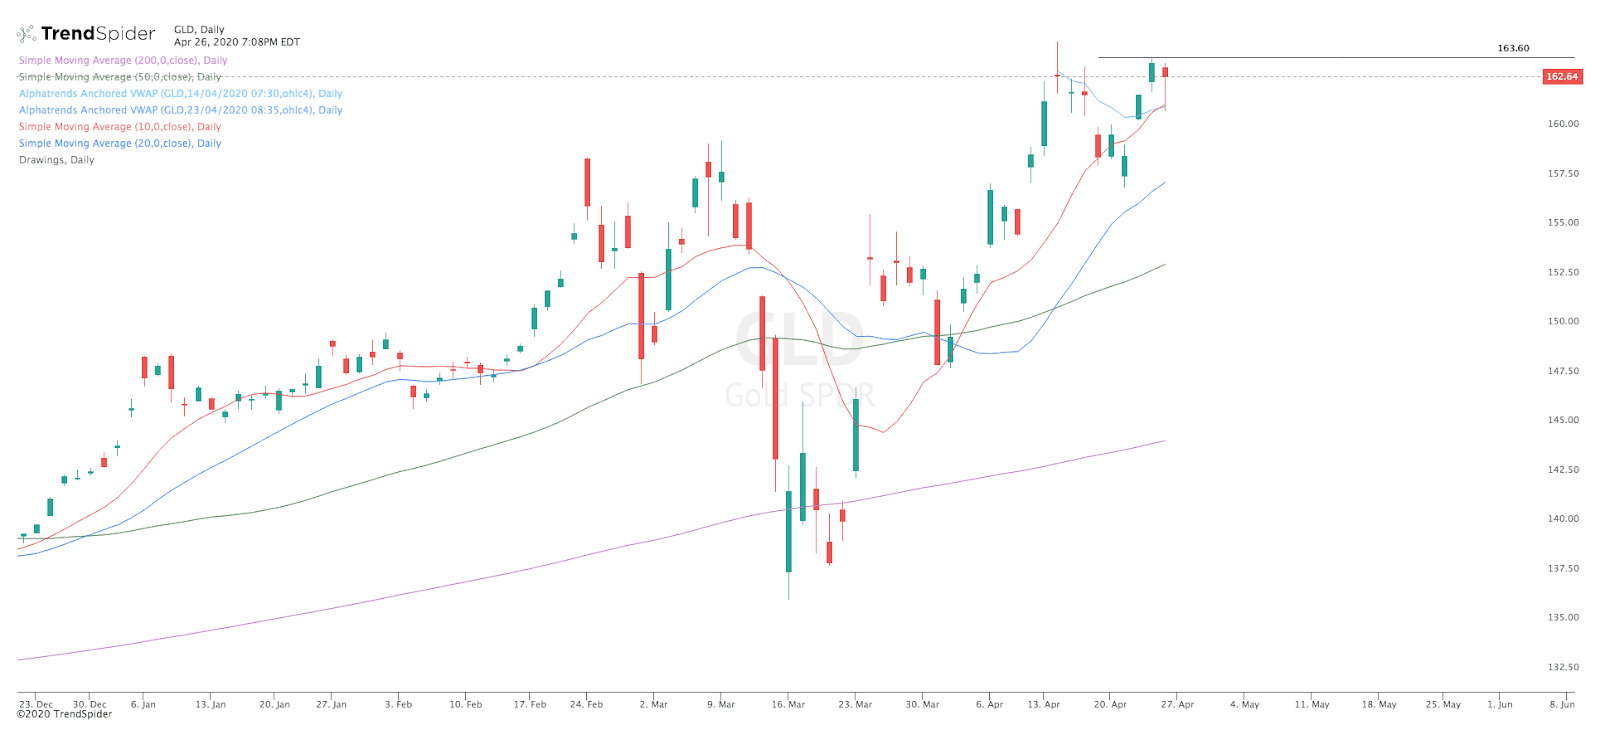
Day Chart

65 minute chart.
Why 65-minute chart. There are 10 65-minute periods in the trading day and we can use the information on the shorter timeframe for our entries or exits.
I like GLD above 163.60. Levels for stops are 160.87 or 157.04
HAIN CELESTIAL GROUP (HAIN)

Day Chart
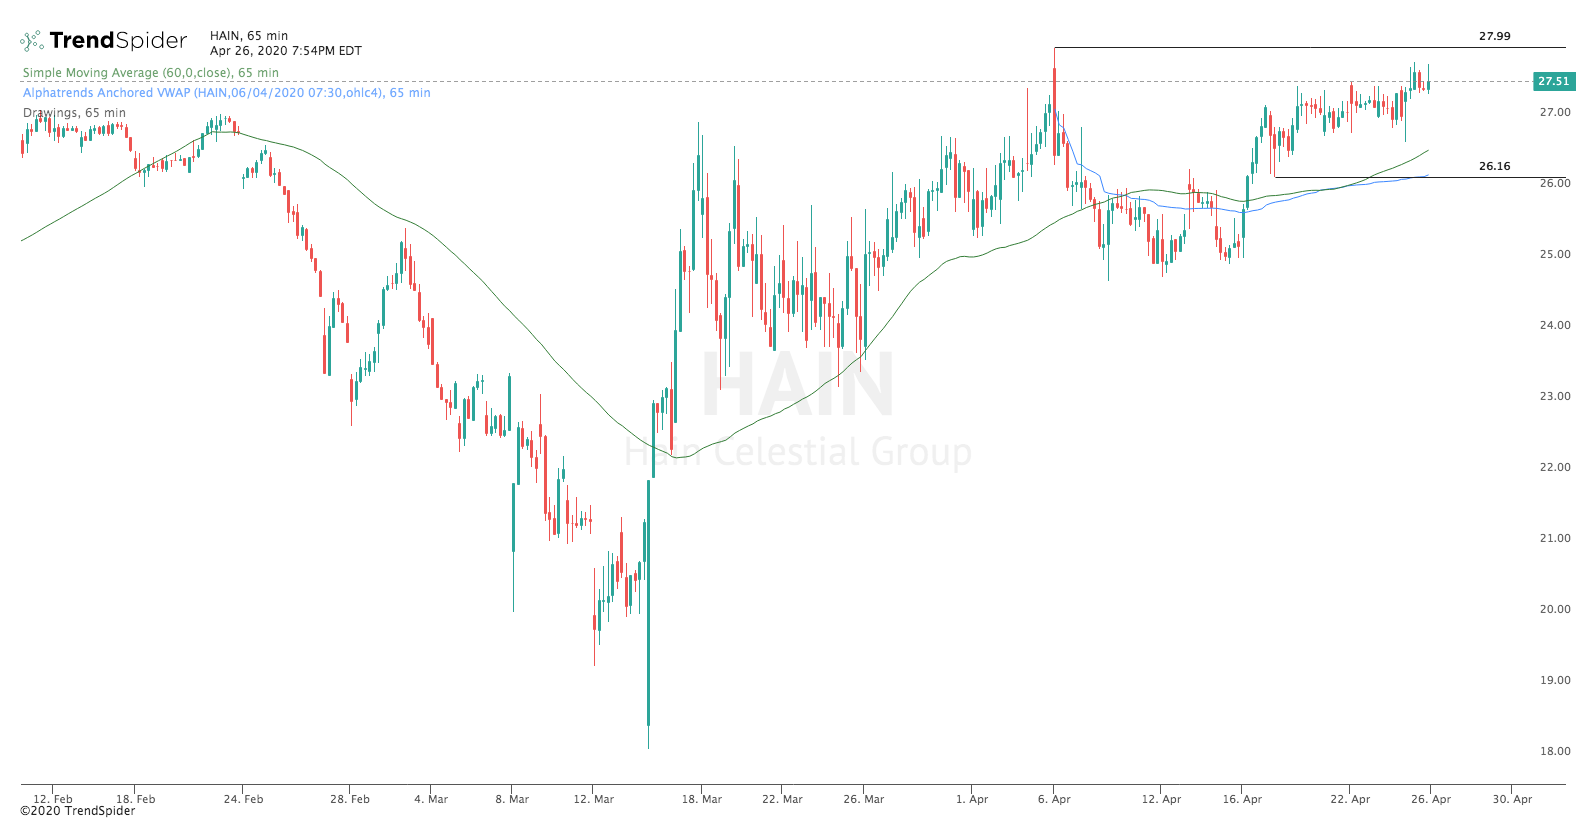
65 Minute chart.
HAIN looks like it is ready to break out above 28.00. Using, the 65-minute chart, I would place the initial stop at 26.10 beneath the green 60- period moving average and the blue VWAP from the swing high.
Position size accordingly.
Please confirm if they report earnings on March 6. I do not recommend holding over earnings.
I will update in my Telegram group.
That is all for now!
Drop me a line with any questions or comments.
I am actively posting charts and ideas on social media.
You can find me here:
Klarenbach Research: klarenbach.ca
Telegram: Klarenbach Research
Twitter: @trentklarenbach
StockTwits: trentklarenbach
Tradingview: trent.klarenbach
I hope that you find the FREE Klarenbach Report worthy of your time and that you choose to hit the subscribe button below.
Please share with anyone else that you think may enjoy it also.
Remember.. It is FREE!
Life is Good