Bitcoin Crash, Stock Market....?
May 10, 2020


May 10, 2020
Will this weekend’s Bitcoin crash lead to a stock market pullback?
An observation over the last few months has been that Bitcoin’s behaviour over the weekend has foreshadowed how the S&P Futures react at the open on Sunday night and Monday morning’s stock market.
Bitcoin crashed hard this weekend from over $10,000 to a low near $8,100. The bulk of this drop happened in 10 minutes. Price has since recovered to $8700 at the time of publication.
Sunday night and Monday morning will be interesting.
I started a free Telegram group, Klarenbach Research, where members can post ideas and ask Technical Analysis related stock market questions.
My midweek trade ideas and commentary will also be posted there as execution is quicker than the newsletter.
I hope this group will create a community to ask questions and expand our knowledge of trading and investing.
Telegram is a messaging app with a focus on speed and security, it’s super-fast, simple and free. You can use Telegram on all your devices at the same time — your messages sync seamlessly across any number of your phones, tablets or computers.
This is the link https://t.me/klarenbachresearch.
It is still pretty young, however, we are adding members who are contributing ideas and questions regarding traditional markets and Bitcoin.
I hope you check it out.
MARKET REVIEW
This week may determine if this a dead cat bounce or if the market is going higher.
It will be interesting to watch.
Be careful with your long positions and long entries.
**Click on any chart to enlarge**
S&P 500 Index (SPX)

On April 5, I posted a daily chart of how I thought price action would play out. You can find it on TradingView here: https://www.tradingview.com/chart/SPX/tFmCL9rR-SPX-Idea/
So far my idea has been pretty accurate.
As expected in previous newsletters, price reached the Golden Pocket area between the .618 and .65 fib retracement levels closing within my green area of interest.
We discussed this level of interest here: https://klarenbach.substack.com/p/uncertain-times
It will be interesting to see how price reacts to the .65 fib level and the purple 200 DMA
I still believe that this is a dead cat bounce and will be looking for confirmation to go to cash or to enter short positions. However, some of the following charts are throwing water on that idea.
At this time, I still consider the B Wave from my March 26 tweet near completion and am waiting for confirmation of the C wave formation.

NASDAQ INDEX (NDAQ)

The NASDAQ is green for 2020 and is bullish above the advancing 10,20, 50 and 200 Day Moving Averages.
Dow Jones Industrial Average (DJIA)

On April 5, I posted a daily chart of how I thought price action would play out. You can find it on TradingView here: https://www.tradingview.com/chart/DJI/2qne4HCp-DJI-IDEA/
The DJIA is weaker than the S&P 500 and the NASDAQ but is showing signs of life with price above the 10, 20 and 50 DMA. The 50 DMA is flattening out so maybe the price will make it to the overhead 200 DMA.
Until I get new information, I still think this is a dead cat bounce with further downside.
TSX Composite Index (TSX)

On April 5, I posted a daily chart of how I thought price action would play out. You can find it on TradingView here:
https://www.tradingview.com/chart/TSX/ZHhZrUpz-TSX-Idea/
Price continues to test the light blue YTD VWAP inside my area of interest and is above the shorter term Moving Averages.
S&P 500 Volatility Index (VIX)

The S&P 500 goes down, the VIX goes up. The S&P 500 goes up, the VIX goes down.
West Texas Oil (WTIC)

Oil keeps grinding higher and that is good for my part of the world.
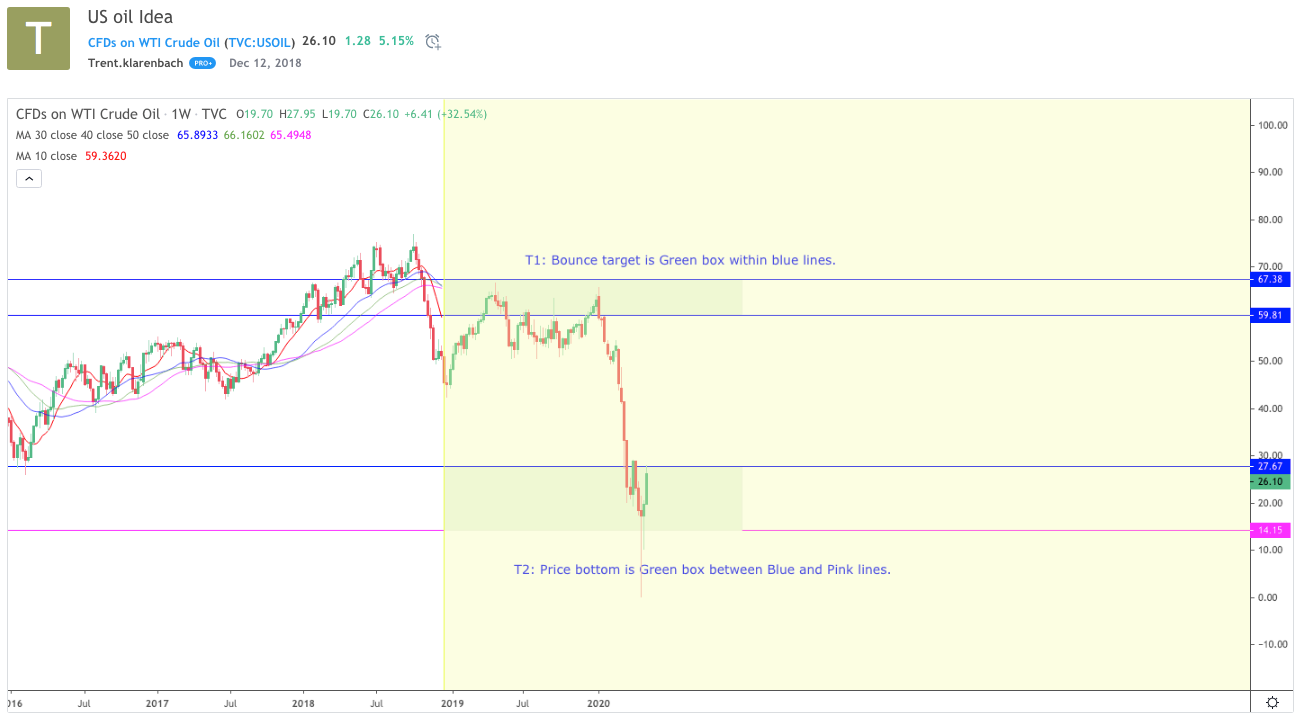
If you are interested in an example of how Technical Analysis can be effective in forecasting price action, check out this December 12, 2018 oil forecast on Tradingview.
Here is the link: US oil Idea for TVC:USOIL by Trent.klarenbach
I combined fibonacci retracement and extensions with support and resistance lines to create the forecast. It turned out well.
TradingView allows posting of ideas and with paid subscriptions allowing one to see the following price action. The chart below depicts the price action since the original post.
SPDR Gold Trust (GLD)

GLD did not break the recent highs and has retraced. I expect further retracement this week. A level of interest for a bounce will be the green 50 DMA.
US Dollar / Canadian Dollar (USDCAD)
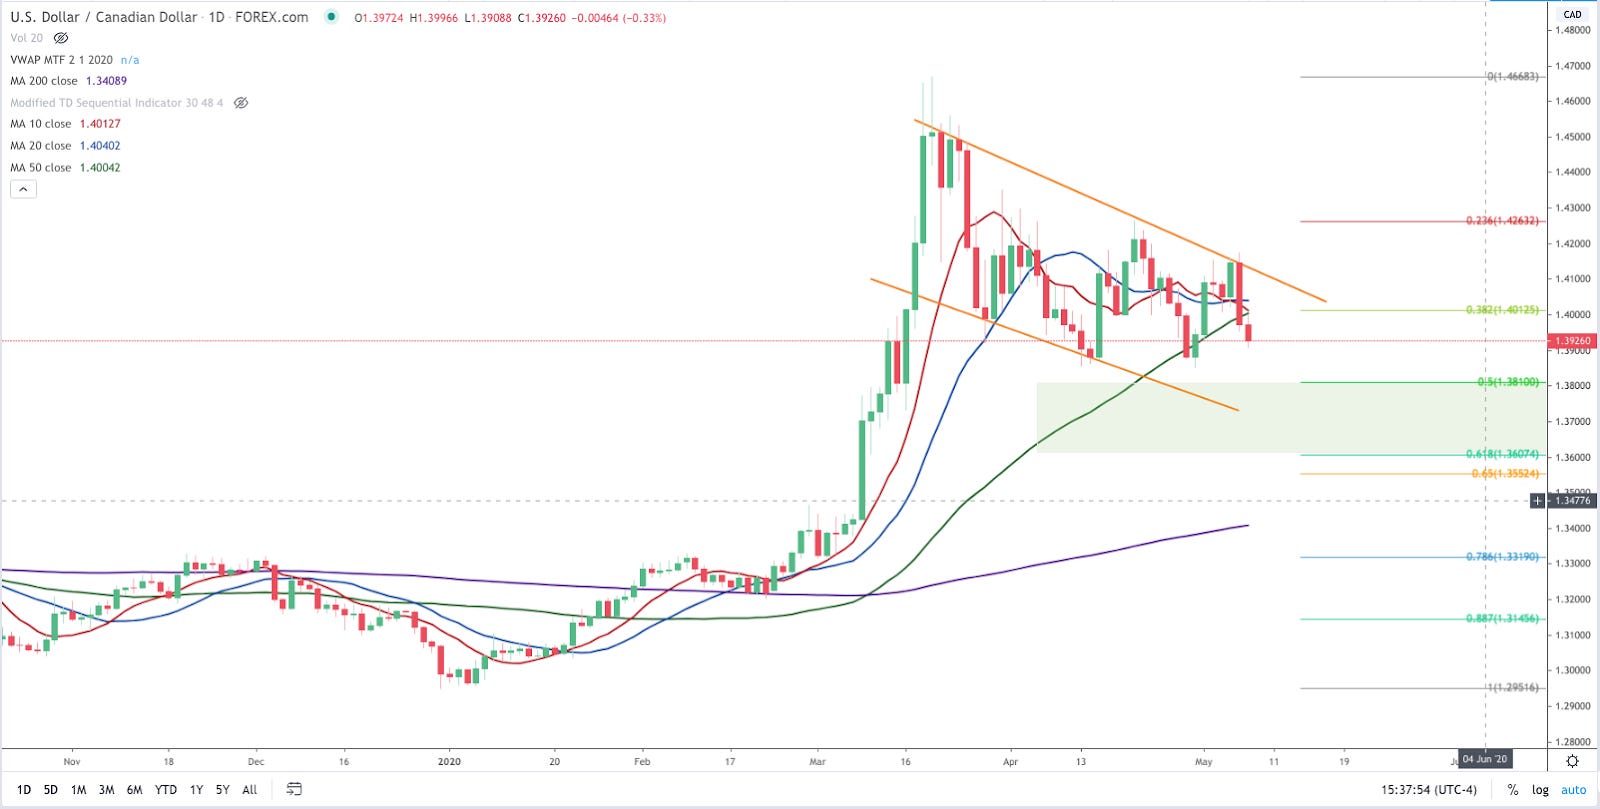
I was bullish last week, however, the recent price action has me bearish again keeping with the original target area.
Last week, I questioned my upper trend line. This week I made the change.
As always, adjustment may be necessary as more information is available.
BITCOIN (BTC)

BTC had another strong week reaching $10,055 on the BLX Index and continues to look strong.
The above Weekly chart is the BLX index with my version of the Hyperwave phases. I won’t get into the Hyperwave theory, however, subscribers to that theory recognize how important Sunday’s weekly close is. A close below the Phase 7 line means that sub $1000 is still on the table.
The Bitcoin Halving is expected to occur at approximately March 12 10 pm CST. This is a big deal.
WHEAT FUTURES (ZW1!)

Nothing to see here.
This is a no trade zone for me.
SOYBEAN FUTURES

I still think Soybeans are setting up for a nice long swing trade position above the lower Moving Averages in the $9 area.
TLT vs SPY
(ISHARES 20+ YEAR TREASURY BOND ETF vs SPDR S&P 500 ETF TRUST
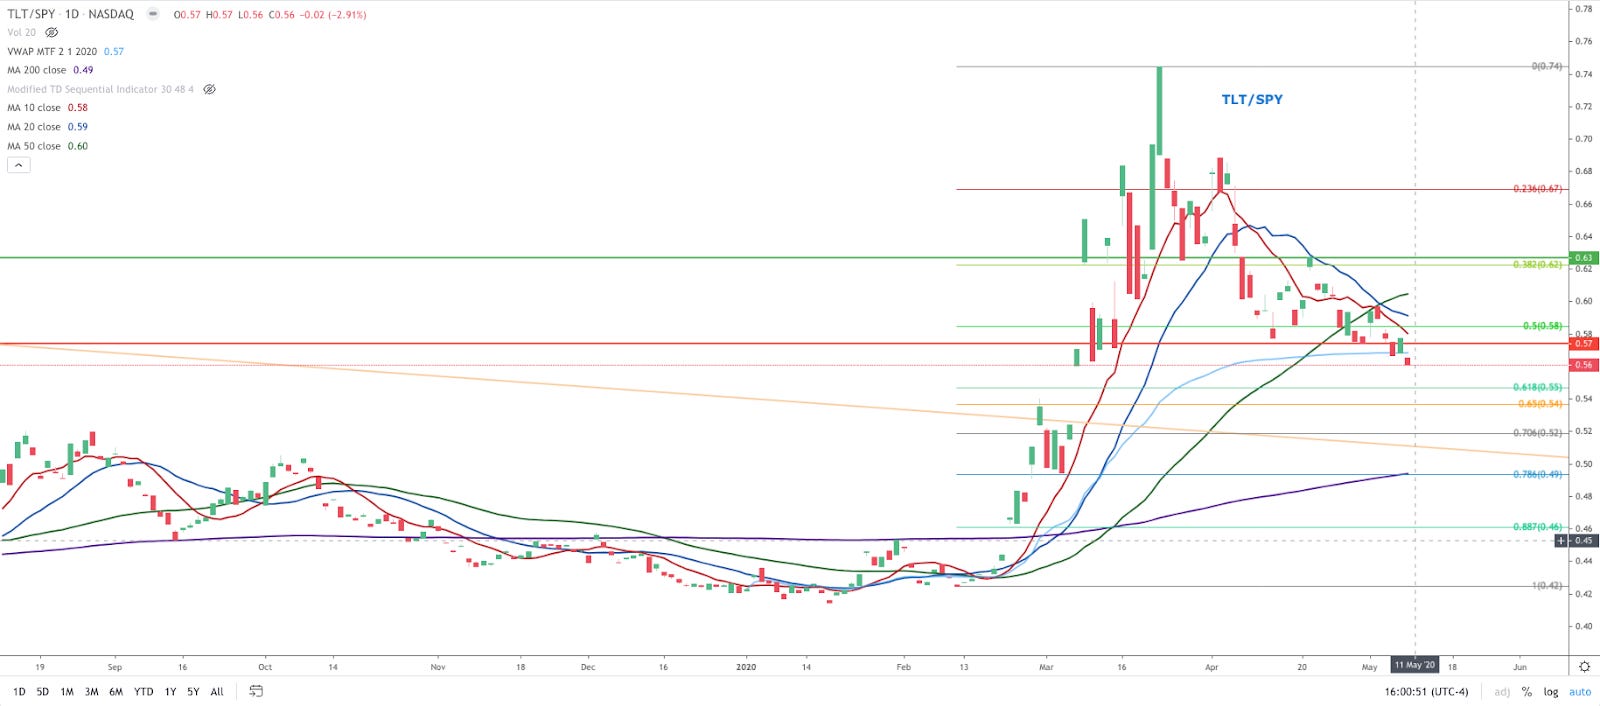
This chart compares TLT vs the SPY.
We initially discussed this chart in the March 29, 2020 Anticipating a Change in Market Direction publication and how it was used to stay out of the S&P 500 as it was setting all-time highs.
From last week:
Currently, the market participants are indecisive between TLT and the S&P 500.
If we get a candle close above the green line, TLT will be breaking out against the SPY and we will direct our attention towards Bonds.
If we close below the red line, then the SPY is out performing TLT and we will focus our attention there.
I interpret this as an acceleration from Bonds to Equities.
INVESTOR CLASS IDEAS
Since late January, we have maintained our long-term investment focus on bonds instead of equities.
We discussed how we arrived at that strategy in a March 29th publication found here: https://klarenbach.substack.com/p/anticipating-a-change-in-market-direction
The Investor Class opportunities remain pretty thin
Mix in earnings this week and the list gets even smaller.
As a result, our list continues to be pretty small.
Investing requires patience and a lot of sitting around waiting for a good opportunity.
REMEMBER, CASH IS A POSITION
Let’s take a look at some Investor Class Ideas carried over from last week.
KROGER CO (KR)

KR is now green from our original idea at 33.10.
We are moving our original stop from 30.01 to 31.07.
We identified another entry in the Telegram Group on Monday at 32.64 with a stop at 31.05.
Remember to reset your stops daily after the 1st 30 minutes of the open to avoid having the volatility whipsaw you out of your position.
I will continue to update in my Telegram group.
SWING TRADE IDEAS
We should see a few more swing trade opportunities this week.
I have a list of 58 prospects that I will be monitoring and will post in my Telegram group as a trade sets up.
Here is the link: https://t.me/klarenbachresearch
APACHE CORP. (APA)

I will be monitoring closely and raising my stops on a lower time frame.
APA is up over 120% since the idea was published in the April 5 newsletter.
AURORA CANNABIS (ACB)

ACB is down 18% since the idea was published in the April 5 newsletter.
This is a great lesson in the importance of position sizing and risk management in counter-trend trades.
This is especially important when trading penny stocks where small moves are large moves.
I am losing patience with this stock and may exit this week.
CIEN CORP (CIEN)


CIEN looks interesting on both the Day and 30 minute charts.
I will be looking for an entry above 48.00 with the initial stop under 45.70.
I will wait 30 minutes after the market opens before entering and will update in the Telegram Group.
ZYNGA INC (ZNGA)


I am interested in ZNGA. I am using the 30 minute chart to pick the entry and exit.
Entry: 7.90
Exit: 7.54
I will observe how price behaves in the first 30 minutes and will update in the Telegram Group.
That is all for now!
Drop me a line with any questions or comments. You can do that here
I am actively posting charts and ideas on social media.
You can find me here:
Klarenbach Research: klarenbach.ca
Telegram: Klarenbach Research
Twitter: @trentklarenbach
StockTwits: trentklarenbach
Tradingview: trent.klarenbach
I hope that you find the FREE Klarenbach Report worthy of your time and that you choose to hit the subscribe button below.
Please share with anyone else that you think may enjoy it also.
Remember.. It is FREE!
Life is Good
This newsletter is sponsored by Mojocial Media.