Dead Cat Bounce?


I started a free Telegram group, Klarenbach Research,
https://t.me/klarenbachresearch,
where members can post ideas and ask Technical Analysis related stock market questions.
My midweek trade ideas and commentary will primarily be posted there as execution is quicker than the newsletter.
I hope this group will create a community to share ideas and expand our knowledge of Technical Analysis.
Telegram is a messaging app with a focus on speed and security, it’s super-fast, simple and free. You can use Telegram on all your devices at the same time — your messages sync seamlessly across any number of your phones, tablets or computers.
Again, this is the link https://t.me/klarenbachresearch.
I hope you check it out.
MARKET REVIEW
As I suggested in my Pulling in the Reins newsletter, I exited my long S&P 500 index positions prior to the last hour of Friday’s trading.
Unfortunately, I missed a pretty good late day move.
Such is life.
I will sleep well this weekend.
However, I did see pretty healthy contango in the oil futures on Friday which led me to keep my long oil related positions.
I probably won’t sleep well this weekend.
Hey, I appreciate the feedback with ideas on how to improve this newsletter. Keep them coming!
One common theme is that Technical Analysis is a new concept and that readers are not familiar with the acronyms, terms and the charts.
I will make a better effort to explain the concepts starting with a Glossary and chart legend at the beginning of this week’s Market Review.
I remember being shown charts and not having a bleeping clue what was going on.
It gets better.
Glossary
MA: Moving Averages are price based, lagging (or reactive) indicators that display the average price of a security over a set period of time.
DMA: Day Moving Average, ie. 5 DMA, 10 DMA, 20 DMA, 50 DMA, 200 DMA
WK: Week
VWAP: Volume-Weighted Average Price is a measure of the average price at which a stock is traded over the trading horizon. If price is above the VWAP, the average purchase is profitable. If the price is below, the average purchase is losing money. It can be a great measure of sentiment.
YTD: Year-to-Date
TD: TD Sequential Trading strategy is designed specifically to predict potential price exhaustion and likely price reversals. A TD9 count can, but does not always precede a price reversal.
Fib level: Fibonacci sequence level. The Golden Ratio of 1.618 and its inverse, 0.618 are found in nature, architecture, fine art and biology. It is fascinating.
Dead Cat Bounce: A dead cat bounce is a small, brief recovery in the price of a declining stock or market.
Chart Legend
Day Chart Weekly Chart
Red sloping line: 10 DMA Red sloping line: 30 WK MA
Blue sloping line: 20 DMA Blue sloping line: 40 WK MA
Green sloping line: 50 DMA Green sloping line: 50 WK MA
Purple sloping line: 200 DMA Purple sloping line: 200 WK MA
Light blue sloping line:YTD VWAP Light blue sloping line: YTD VWAP
S&P 500 Index (SPX)

https://www.tradingview.com/chart/SPX/tFmCL9rR-SPX-Idea/
Price is on a green TD9 count at the confluence of the YTD VWAP and the green 50 DMA within my green area of interest.
We discussed this level of interest here: https://klarenbach.substack.com/p/uncertain-times
I do expect that price can continue higher to the .618 Fib or the .65 area.
However, I believe that this is a dead cat bounce and will be looking for confirmation to go to cash or to enter short positions.
At this time, I consider the B Wave from my March 26 tweet near completion and am waiting for confirmation of the C wave formation.

SPY (SPDR S&P 500 ETF TRUST)

The SPY price::
At the declining green 50 DMA (negative);
Below the declining purple 200 DMA (negative);
Below the .618 Fib level (neutral);
Above the light blue YTD VWAP (positive); and
Closed on a TD9 (negative).
I consider this more negative than positive, HOWEVER, THE MARKET DOES NOT CARE WHAT I THINK.
NASDAQ-100 Index (NDX)

NDX closed above the .65 fib level showing more strength than the SPX. This is not surprising given the strength of the tech sector.
NDX:
Above the Golden Ratio (0.618 fib level) (positive)
Above the purple 200 DMA (positive)
Above the declining green 50 DMA (positive)
Closed on a green TD9 (negative)
I am expecting a 1-4 day pullback and then continuation to the upside.
The NASDAQ feels and looks better than the S&P 500.
Dow Jones Industrial Average (DJIA)

https://www.tradingview.com/chart/DJI/2qne4HCp-DJI-IDEA/
Until I get new information, I think this is a dead cat bounce.
TSX Composite Index (TSX)

https://www.tradingview.com/chart/TSX/ZHhZrUpz-TSX-Idea/
The TSX is lagging behind the previous indexes, however, the flip to the green TD1 count is interesting. I think there is still room to move up.
The light blue YTD VWAP and green 50 DMA are just overhead. I expect the move to be limited.
S&P 500 Volatility Index (VIX)

The VIX is dropping which could mean the S&P has more upside. Or not.
I am short VXX so...
West Texas Oil (WTIC)
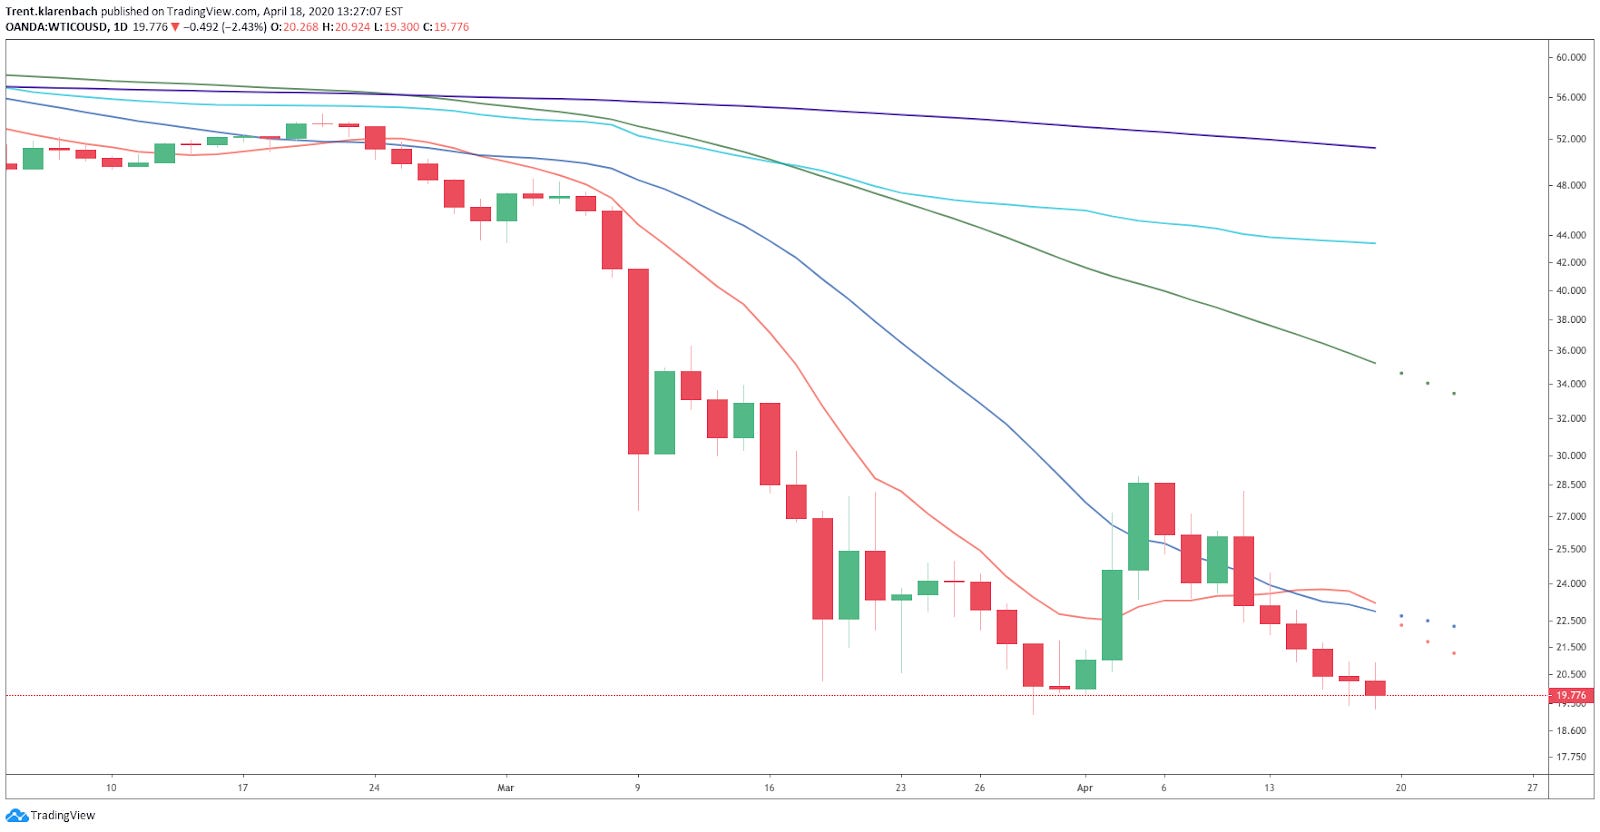
Last week, I stated that I can see another leg up.
It has not happened yet, however, that idea is still valid until price makes a new low below 19.121.
As I mentioned earlier, I kept my long oil stock and option positions over this weekend. They are currently profitable and when looking at the contango in the futures market I decided to keep on keepin’ on.
SPDR Gold Trust (GLD)

GLD broke out and is now testing the previous resistance. I can see the price closing the gap at 156ish before continuing higher.
Price is still looking strong above the advancing 50 and 200 DMA.
GLD reached the T1 Price Target from my March 14 Tradingview published idea.
You can find it here: https://www.tradingview.com/chart/GLD/NRyxPEpN-GLD-Idea-GLD/
It is a weekly chart and the recent lows are not easily identified on the chart.
US Dollar / Canadian Dollar (USDCAD)
Three weeks ago, a reader brought this one to my attention, stating that the USDCAD pair has only been this strong 0.6% of the time in his 20 year trading career.
Looking at the weekly chart, we could see that the weekly candle was on a TD9 of this version of the Tom Demark Sequential Indicator. This was a good short opportunity.
Looking at the Daily chart, the .236 fib level seems to be acting as resistance. There could be more downside to the .5 fib level.
Note: this reader is David Nobbs. He is sharp. Listen to what he says.

As we discussed last, the .236 fib level did act as resistance and we are keeping our first target at the .5 fib level.
A falling wedge seems to be forming. If so, we have confluence with the green 50 DMA and the .5 fib level which will be near the apex of the wedge.
Perhaps, price will bounce there and break out above the wedge pattern.
The closer we get to the apex the less likely the breakout to the upside.
I am not a huge fan of wedges, however………...
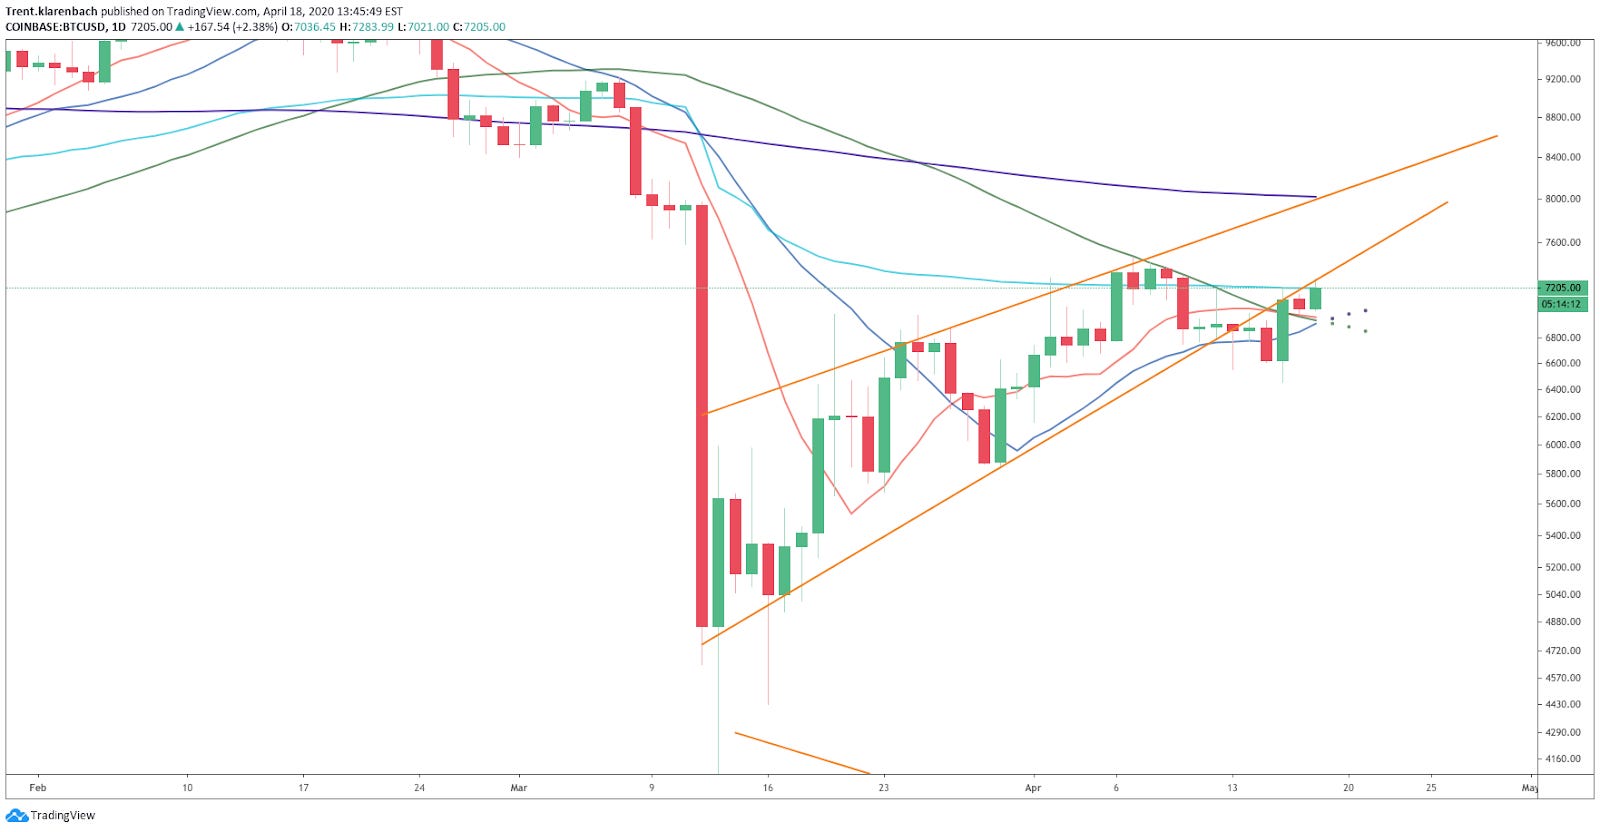
BITCOIN (BTC)
From last week:
BTC made a 25 day move from 3858 to 7466.
Looks bullish, however, the move was on declining volume.
Price is below a declining 50 DMA and the declining 200 DMA.
DO NOT TRUST THIS MOVE.
Recently, BTC price moves have been coupled with the SPX.
If you think the S&P 500 will go lower, what will BTC do?
The S&P 500 advanced as did BTC this past week.
This is a Coinbase chart.
I see a rising wedge pattern forming with the price backtesting the bottom trend line.
Price is also below the YTD VWAP and purple 200 DMA.
I don’t trust this move and am currently bearish.
The halving occurs next month which is bullish, however, today’s chart tells me otherwise.
I still think that $1000 is on the table, so I will be keeping some powder dry.
WHEAT FUTURES (ZW1!)

From last week:
Wheat looks to be testing the top of the ascending triangle for the 5th time.
The more time it gets tested, the weaker it becomes.
If Wheat breaks out then our measured move minimum target is 762’6.
This should make my farmer friends happy.
Wheat got rejected at the top of the ascending triangle.
Price is still above all key moving averages.
I still like this setup.
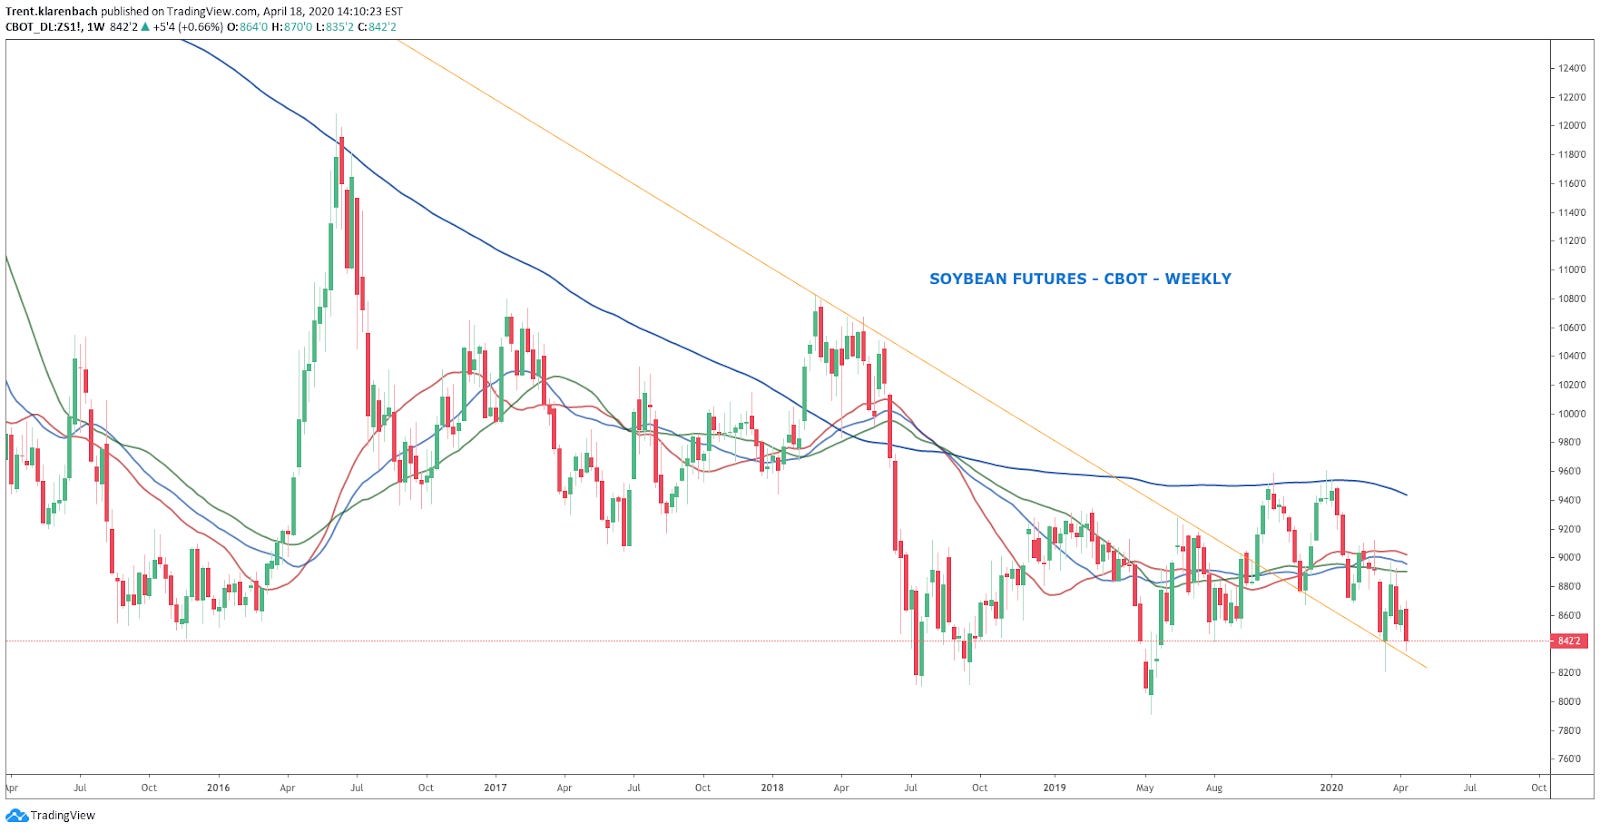
SOYBEAN FUTURES
From last week:
I like the look of this soybean chart as price has broken out of and is now testing the downward sloping trendline.
It looks like a change in trend to the upside could happen.
The price closed lower this week and is below key moving averages.
Not exactly confidence building.
INVESTOR CLASS IDEAS
The recent fast and powerful move in the markets have resulted in most stocks and ETFs failing to meet our investor class criteria.
We will continue to monitor for opportunities, however, we will most likely wait for the market to settle down before making a long-term investment in equities.
Since late January, we have maintained our long-term investment focus on bonds instead of equities.
We discussed how we arrived at that strategy in a March 29th publication found here: https://klarenbach.substack.com/p/anticipating-a-change-in-market-direction
REMEMBER, CASH IS A POSITION
SWING TRADE IDEAS
The big moves of the last couple weeks have made me pretty cautious heading into next week.
I am also expecting a pullback this week and the end of a dead cat bounce.
As a result, we will review last week’s ideas and how they played out.
If I identify any ideas during the week, I will post in my Telegram group.
Here is the link: https://t.me/klarenbachresearch
BEYOND MEAT (BYND)

The swing trade was triggered.
Price is behaving as expected. This pullback could be a good swing trade entry with a stop beneath the recent low.
If I take the trade, I will use a small position size.
From previous newsletters:
https://www.tradingview.com/chart/BYND/ZtNu58sA-BYND-Idea/
We mapped out this price action for a possible ABC correction. Our first B Wave target in the lower green box was reached..
We will be monitoring the price to see if it breaks above 78.60 before we get too excited about the Wave C target.
This is a counter trend trade and should be monitored closely with smaller than normal position size.
APACHE CORP. (APA)

APA closed the week up 57% from the idea published two weeks.
I stayed in this position for the reason’s explained earlier.
Positive oil news, oil price drops, stock price rises.
This is one reason, I don’t watch the news or listen to pundits.
AURORA CANNABIS (ACB)

ACB is down 15% from the idea when first published.
This is a great lesson in the importance of position sizing and risk management in counter-trend trades.
This is especially important when trading penny stocks where a small move is large in percentage terms.
Hopefully, it will take off this week.
That is all for now!
Drop me a line with any questions or comments. You can do that here
I am actively posting charts and ideas on social media.
You can find me by clicking the links below:
Klarenbach Research: klarenbach.ca
Telegram: Klarenbach Research
Twitter: @trentklarenbach
StockTwits: trentklarenbach
Tradingview: trent.klarenbach
I hope that you find the FREE Klarenbach Report worthy of your time and you choose to hit the subscribe button below.
Please share with anyone else that you think may enjoy it also.
Remember.. It is FREE!
Life is Good
This newsletter is Sponsored By Mojocial Media