Do Riots Happen in Bull Markets?


May 31, 2020
Do riots and civil unrest happen during bull markets?
Tonight’s futures and tomorrow’s price action will be interesting to watch.
I recently began an Introduction to Trading and Investing Workshop that will provide you with the tools and confidence to take control of your investments.
I believe that this workshop will be of great benefit to both new traders and veteran investors. You can sign up on my website with this link: Trading and Investing Workshop
Our free Telegram channel, Klarenbach Research, is growing in numbers and the members are getting more comfortable with asking questions regarding traditional markets and Bitcoin.
This is the link https://t.me/klarenbachresearch.
I hope you check it out.
We had a pretty good week with our Trade Ideas and the ideas posted on our Telegram channel.
I have included the posted open and closed trades since the publication started.

As you can see, finding Investor Class Ideas has proven difficult with more success with Swing Trade Ideas and the Telegram channel. There are a few blemishes, but overall we are pleased with our results.
MARKET REVIEW
Do widespread riots and civil unrest occur in bull markets? Is the stock market correlated with the economy?
Dr. Fly has an interesting opinion article on the state of affairs in America. You can find it here. Long Time Coming: America Burns
This is a fascinating time and this week will be interesting to watch.
At the risk of sounding like a broken record, Be careful with your long positions and long entries.
**Click on any chart to enlarge**
S&P 500 Index (SPX)

On April 5, I posted a daily chart of how I thought price action would play out. You can find it on TradingView here: https://www.tradingview.com/chart/SPX/tFmCL9rR-SPX-Idea/
So far my idea has been pretty accurate.
We discussed this level of interest here: https://klarenbach.substack.com/p/uncertain-times
Price is still bouncing within my green area of interest above an advancing 50 DMA. The longer price stays in this green area, the more likely it will resume to the upside.
Price is above the 200 DMA. This is bullish.
The TD indicator topped on an 8 count on Thursday with a 9 on Friday. I am now expecting a 1-4 day correction and perhaps this is the top.
I still believe that this is a dead cat bounce, however, I am losing conviction in this idea
At this time, I still consider the B Wave from my March 26 tweet near completion and am waiting for confirmation of the C wave formation.

NASDAQ 100 INDEX (NDX)

The NDX is just below all-time highs and is bullish above the advancing 10,20, 50 and 200 Day Moving Averages. It shows no indication of slowing down. Software is eating the world.
Dow Jones Industrial Average (DJIA)

On April 5, I posted a daily chart of how I thought price action would play out. You can find it on TradingView here: https://www.tradingview.com/chart/DJI/2qne4HCp-DJI-IDEA/
The DJIA is weaker than the S&P 500 and the NASDAQ finding resistance at the .65 fib level. While the price is below the 200 DMA, it is above an advancing 10, 20 and 50 DMA.
Until I get new information, I still think this is a dead cat bounce with a further downside.
ISHARES TRUST RUSSELL 2000 ETF (IWM)

The Russell 2000 got rejected at the .65 fib level below the declining 200 DMA.
TSX Composite Index (TSX)

The TSX is looking similar to the DJIA find resistance at the .618 fib level.
On April 5, I posted a daily chart of how I thought price action would play out. You can find it on TradingView here:
https://www.tradingview.com/chart/TSX/ZHhZrUpz-TSX-Idea/
S&P 500 Volatility Index (VIX)

The VIX is consolidating above the 200 DMA. Perhaps volatility will pick up and the S&P will go lower.
West Texas Oil (WTIC)

GOLD Spot (XAUUSD)
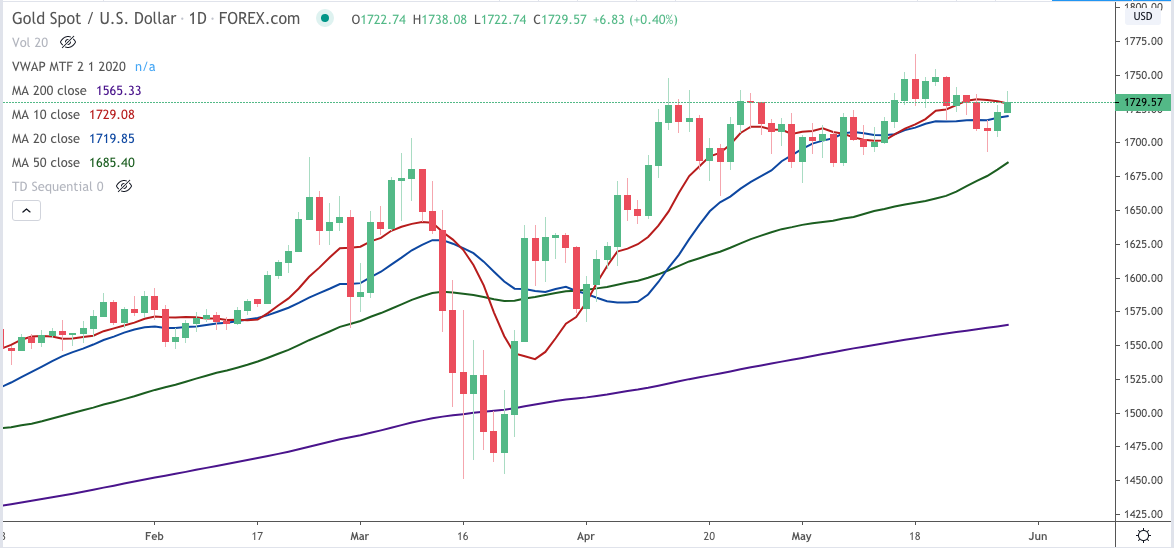
GLD making higher highs and higher lows and looks like it could go higher
US Dollar / Canadian Dollar (USDCAD)

The bears are in control below the declining 10, 20 and 50 DMA and price looks poised to reach the .618 fib level bottom of our area of interest from the April 5th newsletter.
BITCOIN (BTC)

BTC looking interesting
WHEAT FUTURES (ZW1!)

Wheat is still within my Ascending Triangle. The 200 Week MA is advancing which is a bullish sign. A level of interest is where the 200 Week MA and yellow trend line converge. That level could be an opportunity to go long.
Currently, this is a no-trade zone for me.
SOYBEAN FUTURES (ZS1!)

The Soybean price is consolidating and looks like the it could break out of the falling wedge.
TLT vs SPY
(ISHARES 20+ YEAR TREASURY BOND ETF vs SPDR S&P 500 ETF TRUST

I interpret this chart as money continuing to flow from Bonds to Equities suggesting the S&P 500 has more upside.
INVESTOR CLASS IDEAS
The Investor Class opportunities remain pretty thin as the buyers and sellers fight to gain control of the direction of the market.
As Ideas develop and are identified during the week, they will be posted on the Telegram channel.
Here is the link: https://t.me/klarenbachresearch
REMEMBER, CASH IS A POSITION
Don’t FOMO (Fear of Missing Out) into a position. Have a plan.
TSLA TESLA

This past week we got into TSLA in the Telegram Channel above 822.50 with a stop below 785. I am interested in adding to my position above Friday’s high of 835 with the Stop at 785.
SWING TRADE IDEAS
Several stocks that are close to ticking all the boxes, however, they need a few more days to set up.
I have a list of 269 prospects that I will be monitoring and will post on the Telegram Channel as a trade sets up.
Here is the link: https://t.me/klarenbachresearch
AURORA CANNABIS (ACB)

ACB gave up some of its gains and is below the YTD VWAP and the VWAP from the May 15 low. I will most likely exit this on signs of weakness next week.
ACB is up 44 % since the idea was published in the April 5 newsletter.
CIEN CIEN CORP

We have been raising our stops letting our winner run.
Currently, CIEN has 15% from our entry.
ZNGA ZYNGA INC

ZNGA performed well on Friday. We have been raising our stops letting our winner run.
Currently, ZNGA is up 15%.
MEG.TO MEG Energy Corp.
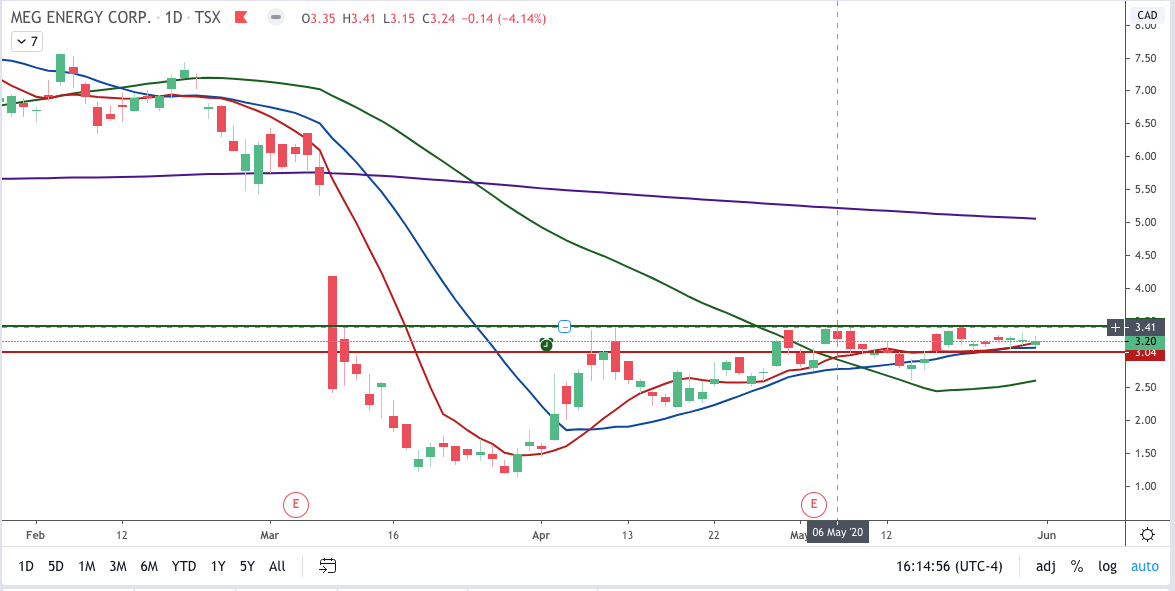
We mentioned MEG last week but it did not trigger. Keep an eye on MEG this week for a break out over 3.42 with a Stop at 3.04.
GRPN GROUPON INC.

I am interested in a Swing Trade with GRPN above 1.31 with a stop under 1.17
That is all for now!
Drop me a line with any questions or comments. You can do that here
I am actively posting charts and ideas on social media.
You can find me here:
Klarenbach Research: klarenbach.ca
Telegram: Klarenbach Research
Twitter: @trentklarenbach
StockTwits: trentklarenbach
Tradingview: trent.klarenbach
I hope that you find the FREE Klarenbach Report worthy of your time and that you choose to hit the subscribe button below.
Please share with anyone else that you think may enjoy it also.
Remember... It is FREE!
Life is Good
This newsletter is sponsored by Mojocial Media.