


Proceed With Caution


Where does the market go from here?
The main market indexes, SPX, NDX, and TSX have entered or are approaching areas of interest.
PROCEED WITH CAUTION
MARKET REVIEW
S&P 500 Index (SPX)
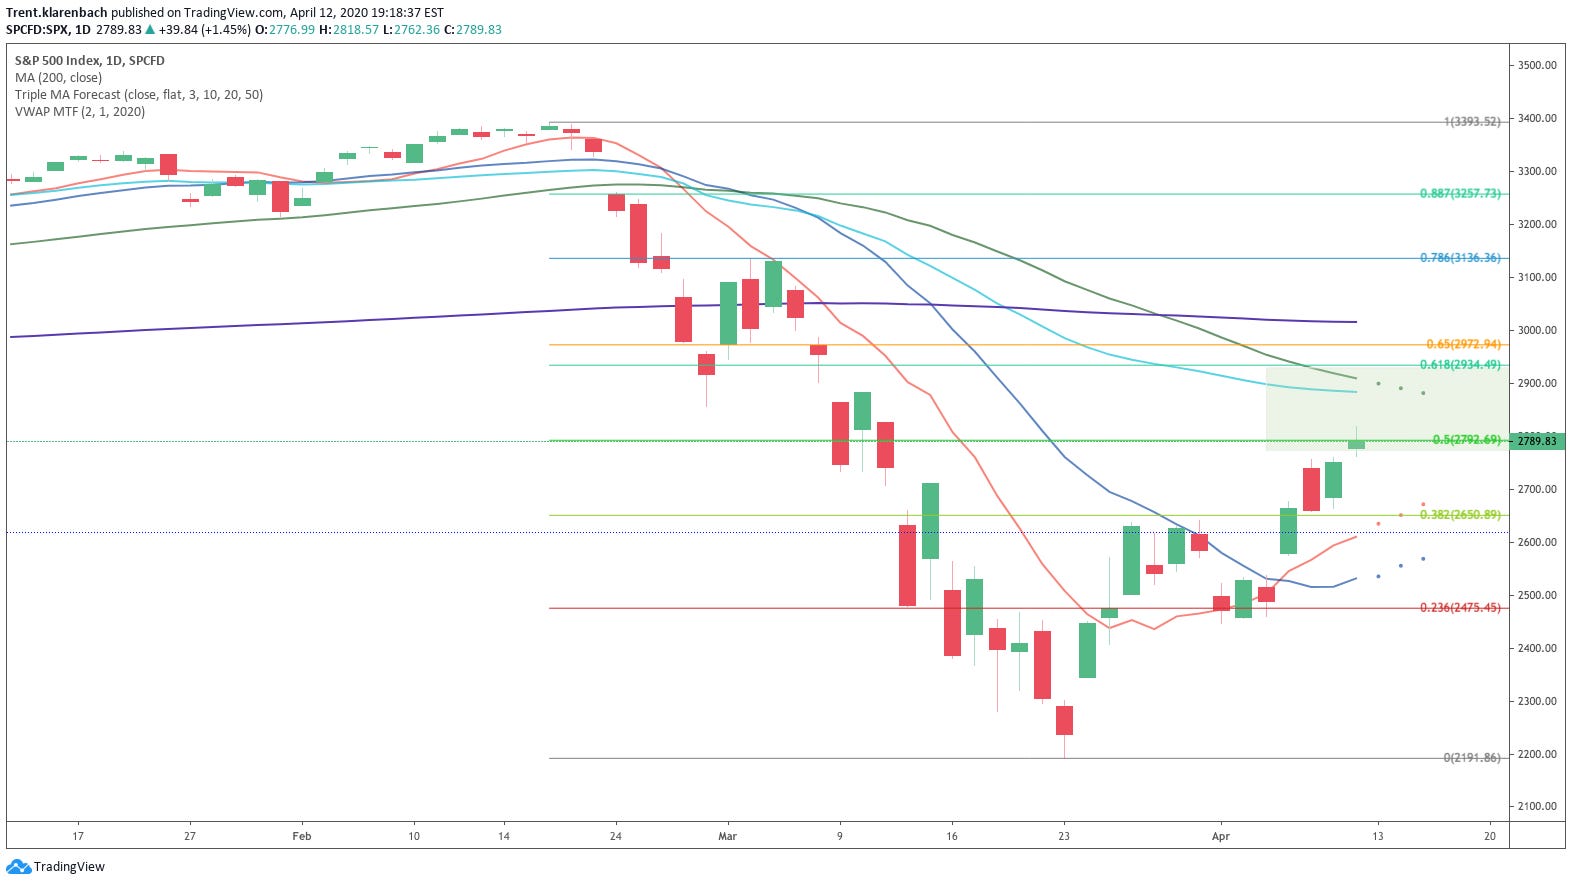
https://www.tradingview.com/chart/SPX/tFmCL9rR-SPX-Idea/
Price broke above the .382 Fibonacci level and reached the green area of interest as suggested in the April 6 newsletter.
You can read it here. https://klarenbach.substack.com/p/uncertain-times
Will price move much higher with the downward sloping YTD Volume Weighted Average Price (VWAP) (light blue), 50 DMA (green) and the 200 DMA (purple) overhead?
Will this green box area of interest between the .5 and .618 fib levels act as a reversal level before continuation to the downside as this tweet suggests?

SPY (SPDR S&P 500 ETF TRUST)

The SPY got rejected by the YTD VWAP and is sitting at the .5 FIb level.
Note, this move was made on declining volume.
USE CAUTION
NASDAQ-100 Index (NDX)

NDX is behaving similarly to SPX finishing the week at the .5 Fibonacci level.
The NDX is stronger than the SPX as the price closed above the 200 DMA.
The 200 DMA has also started sloping down with a 50 200 Day MA death cross pending.
This death cross has more significance when the price is nearby.
This also coincides with my idea of an ABC correction similar to SPX bringing the price closer to the death cross.
Dow Jones Industrial Average (DJIA)
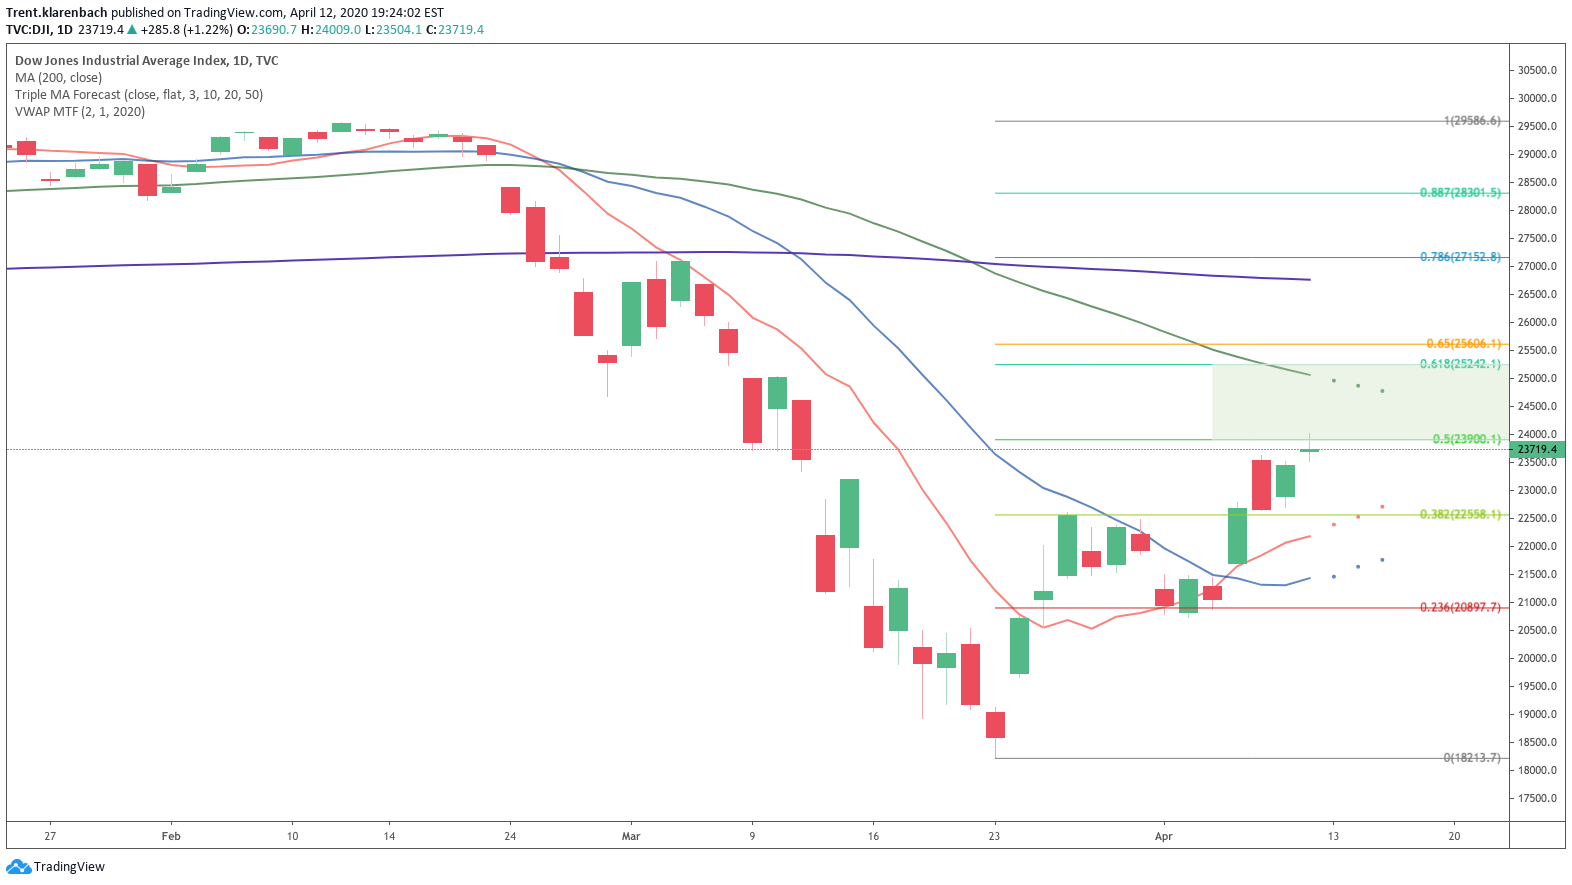
https://www.tradingview.com/chart/DJI/2qne4HCp-DJI-IDEA/
DJI is behaving similar to the SPX and NDX.
TSX Composite Index (TSX)

https://www.tradingview.com/chart/TSX/ZHhZrUpz-TSX-Idea/
The TSX is lagging behind the previous indexes.
S&P 500 Volatility Index (VIX)

The VIX is on a TD Sequential 9 count near the 50 DMA (green) suggesting a 1-4 day pullback in the S&P 500. This coincides with the SPX reaching the .5 Fibonacci level on Thursday.
West Texas Oil (WTIC)
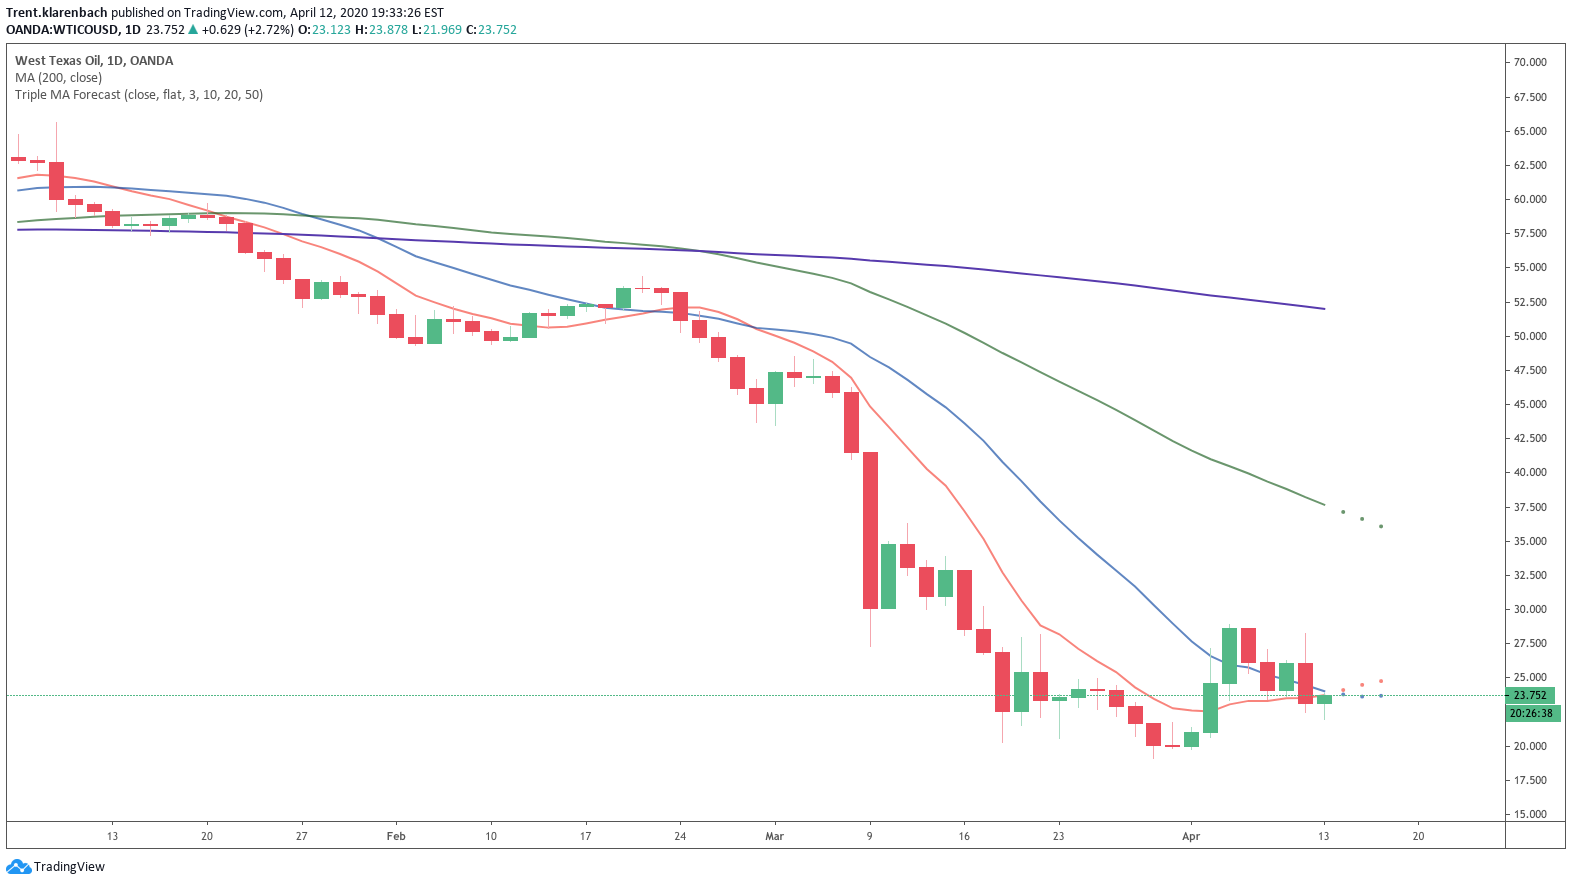
It is hard to get too excited about the oil price, however, I see another leg up happening soon, perhaps up to the green 50 DMA.
I have my long oil positions carried over from last week which has led to a nervous weekend.
SPDR Gold Trust (GLD)


GLD is breaking out and looks like it could test the all-time high.
Price is still looking strong above the advancing 50 and 200 DMA.
GLD reached the T1 Price Target from my March 14 Tradingview published idea.
You can find it here: https://www.tradingview.com/chart/GLD/NRyxPEpN-GLD-Idea-GLD/
It is a weekly chart and the recent lows are not easily identified on the chart.
US Dollar / Canadian Dollar (USDCAD)
Three weeks ago, a reader brought this one to my attention, stating that the USDCAD pair has only been this strong 0.6% of the time in his 20 year trading career.
Looking at the weekly chart, we could see that the weekly candle was on a TD9 of this version of the Tom Demark Sequential Indicator. This was a good short opportunity.
Looking at the Daily chart, the .236 fib level seems to be acting as resistance. There could be more downside to the .5 fib level.

As we discussed last, the .236 fib level did act as resistance and we are keeping our first target at the .5 fib level.
BITCOIN (BTC)

BTC made a 25 day move from 3858 to 7466.
Looks bullish, however, this recent move was on declining volume.
Price is below a declining 50 DMA and the declining 200 DMA.
DO NOT TRUST THIS MOVE.
Recently, BTC price moves have been coupled with the SPX.
If you think the S&P 500 will go lower, what will BTC do?
WHEAT FUTURES (ZW1!)

Wheat looks to be testing the top of the ascending triangle for the 5th time.
The more time it gets tested, the weaker it becomes.
If Wheat breaks out then our measured move minimum target is 762’6.
This should make my farmer friends happy.
SOYBEAN FUTURES


I like the look of this soybean chart as the price has broken out of and is now testing the downward sloping trendline.
It looks like a change in trend to the upside could happen.
INVESTOR CLASS IDEAS
The recent fast and powerful move in the markets has caused most stocks and ETFs to fail to meet our investor class criteria.
We will continue to monitor for opportunities, however, we will most likely wait for the market to settle down before making a long-term investment.
Since late January, we maintained our long-term investment focus on bonds instead of equities.
We discussed how we arrived at that strategy in a March 29th publication found here: https://klarenbach.substack.com/p/anticipating-a-change-in-market-direction
REMEMBER, CASH IS A POSITION
SWING TRADE IDEAS
Last week’s big moves have made me pretty cautious heading into next week.
As a result, we will review last week’s ideas and how they played out.
If I identify any ideas during the week, I will send out an email.
BEYOND MEAT (BYND)

BYND is setting up for a small position swing trade. I did not go long in the green box. It looks like I should have.
https://www.tradingview.com/chart/BYND/ZtNu58sA-BYND-Idea/
From last week:
We mapped out this price action for a possible ABC correction. Our first B Wave target in the lower green box was reached..
We will be monitoring the price to see if it breaks above 78.60 before we get too excited about the Wave C target.
This a counter-trend trade and should be monitored closely with smaller than normal position size.
APACHE CORP. (APA)

APA closed the week up 52% from last week's idea.
Don’t chase.
From last week:
APA looks interesting to me with the consolidation and big price gap.
I will be looking for a long position Monday morning, waiting half an hour after market open before making a decision.
This a counter trend trade and should be monitored closely with smaller than normal position size.

AURORA CANNABIS (ACB)

ACB is up 8% from last week’s newsletter.
Hopefully, it will take off this week.
From last week:
I got in a long position last week. I think there is an opportunity here and may add to my position.
This a counter-trend trade and should be monitored closely with smaller than normal position size with a tight stop.
That is all for now!
Drop me a line with any questions or comments. You can do that here
I am actively posting charts and ideas on social media.
You can find me here:
Klarenbach Research: klarenbach.ca
Twitter: @trentklarenbach
StockTwits: trentklarenbach
Tradingview: trent.klarenbach
I hope that you find the FREE Klarenbach Report is worthy of your time and you choose to hit the subscribe button below.
Please share with anyone else that you think may enjoy it also.
Remember. It is FREE!
Life is Good