Time to be Patient


May 17, 2020
I recently began an Introduction to Trading and Investing Workshop that will provide you with the tools and confidence to take control of your own investments. This will be critical if the market behaves in the near future like I think it will.
It has been a well received one-on-one screen share consultation lasting approximately one hour with a half-hour follow-up.
The follow-up will occur within two weeks where we discuss your challenges while reviewing some of your trades and ideas.
I believe that this workshop will be of great benefit to both new and experienced traders and investors. Reach out to me via your platform of choice from the list at the end of this newsletter. I am slow to respond on Facebook and LinkedIn, but decent with the others.
We had a pretty good week with our Trade Ideas and the ideas posted in our Telegram channel.
To hold myself accountable, I have included the historical posted open and closed trades since the publication started.
As you can see, finding Investor Class Ideas has proven difficult while the Telegram channel has been effective for Swing Trade Ideas. While we are pleased with our results, the challenge now will be to keep our gains.

Our free Telegram channel, Klarenbach Research, is growing in numbers and the members are getting more comfortable with asking questions regarding traditional markets and Bitcoin.
This is the link https://t.me/klarenbachresearch.
I hope you check it out.
MARKET REVIEW
I thought last week would provide more direction on the markets. Perhaps this week will determine if this a dead cat bounce or that the market is going higher.
It will be interesting to watch.
Be careful with your long positions and long entries.
**Click on any chart to enlarge**
S&P 500 Index (SPX)

On April 5, I posted a daily chart of how I thought price action would play out. You can find it on TradingView here: https://www.tradingview.com/chart/SPX/tFmCL9rR-SPX-Idea/
So far my idea has been pretty accurate.
We discussed this level of interest here: https://klarenbach.substack.com/p/uncertain-times
Price is still bouncing within my green area of interest above the declining 50 DMA. The longer price stays in this green area, the more likely it will resume to the upside.
It will be interesting to see how price reacts to the .65 fib level and the purple 200 DMA overhead.
I still believe that this is a dead cat bounce and will be looking for confirmation to go to cash or to enter short positions.
At this time, I still consider the B Wave from my March 26 tweet near completion and am waiting for confirmation of the C wave formation.

NASDAQ 100 INDEX (NDX)

The NDX is green for 2020 and is bullish above the advancing 10,20, 50 and 200 Day Moving Averages.
Dow Jones Industrial Average (DJIA)

On April 5, I posted a daily chart of how I thought price action would play out. You can find it on TradingView here: https://www.tradingview.com/chart/DJI/2qne4HCp-DJI-IDEA/
The DJIA is weaker than the S&P 500 and the NASDAQ with price below the declining 10 and 20 DMA. Price is above the 50 DMA, however, that is declining. Keep an eye on the DJIA next week
Until I get new information, I still think this is a dead cat bounce with further downside.
TSX Composite Index (TSX)

The TSX is looking similar to the DJIA.
On April 5, I posted a daily chart of how I thought price action would play out. You can find it on TradingView here:
https://www.tradingview.com/chart/TSX/ZHhZrUpz-TSX-Idea/
S&P 500 Volatility Index (VIX)

The S&P 500 goes down, the VIX goes up. The S&P 500 goes up, the VIX goes down.
West Texas Oil (WTIC)

Oil keeps grinding higher and that is good for my part of the world.
If you are interested in an example of how Technical Analysis can be effective in forecasting price action, check out this December 12, 2018 oil forecast on TradingView.
Here is the link: US oil Idea for TVC:USOIL by Trent.klarenbach
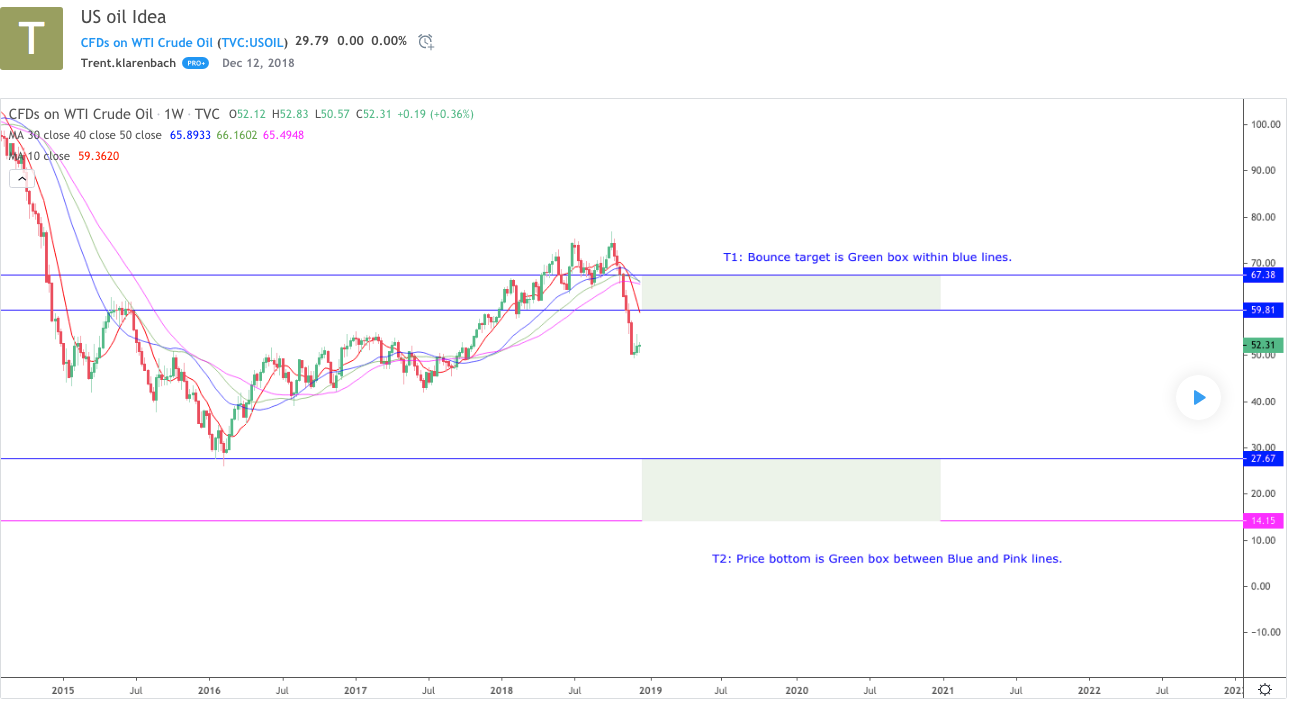
I combined fibonacci retracements and extensions with support and resistance lines to create the forecast. It turned out well.
TradingView allows posting of ideas and with paid subscriptions allowing one to see the following price action. The chart below depicts the price action since the original post.

SPDR Gold Trust (GLD)

GLD broke out of it’s range to the upside.
US Dollar / Canadian Dollar (USDCAD)
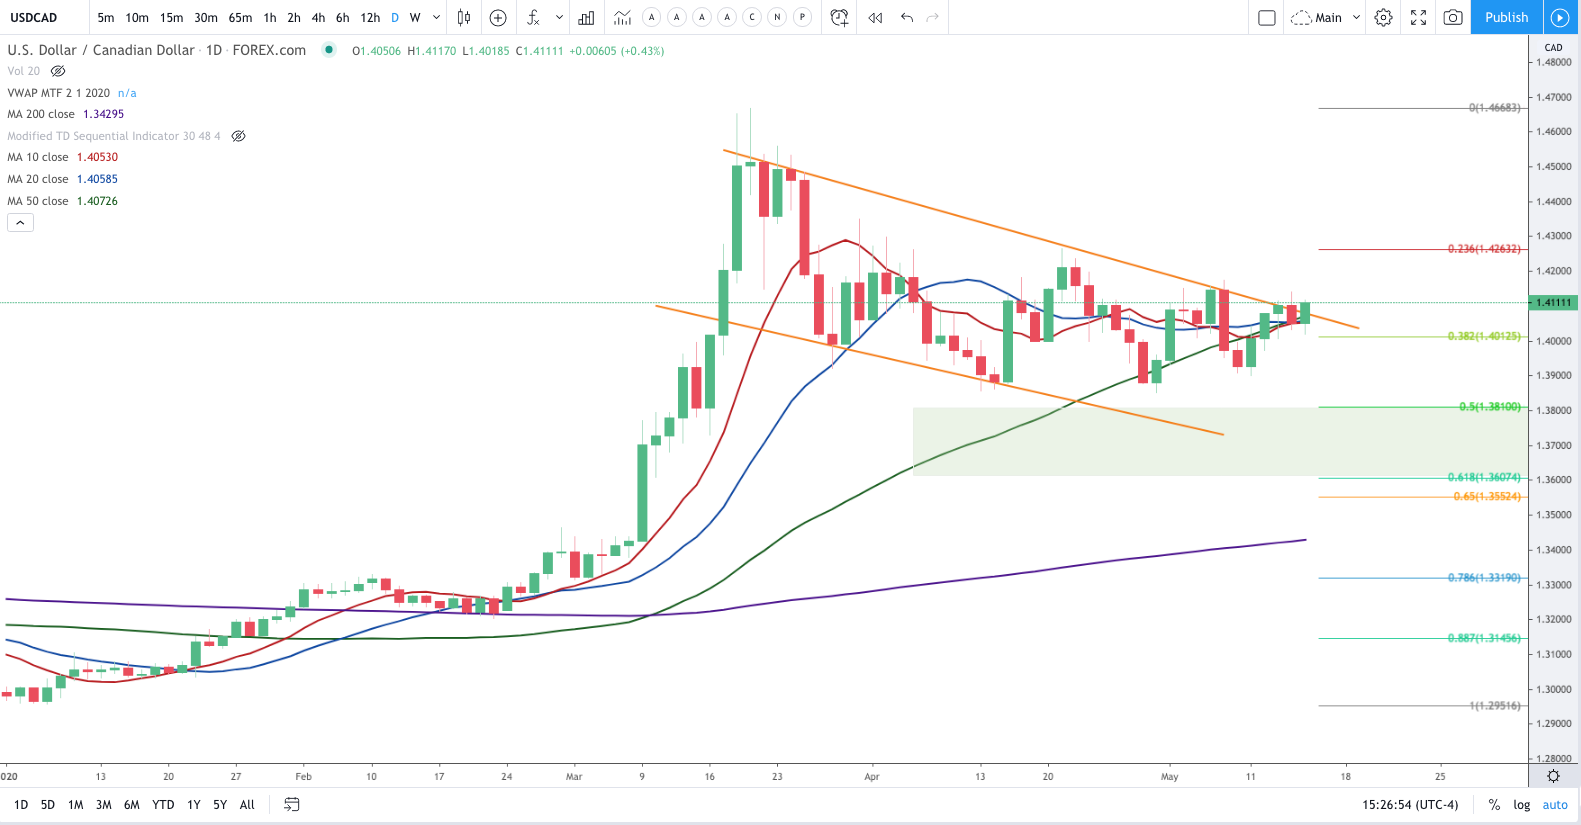
The buyers and sellers are fighting for control with a slight edge to the bulls as price closed the week above the 50 DMA.
BITCOIN (BTC)

BTC on the BLX Index and continues to look strong.
The above Weekly chart is the BLX index with my version of the Hyperwave phases. I won’t get into the Hyperwave theory, however, subscribers to that theory recognize how important Sunday’s weekly close is. A close below the Hyperwave Phase 7 line could mean that sub $1000 is still on the table.
Price at publication is currently 9650 and close to the Hyperwave Phase 7 line. Keep in mind that trend lines should be drawn with a crayon…..
WHEAT FUTURES (ZW1!)

Wheat is still within my Ascending Triangle. A level of interest for me is where the 200 Week MA and yellow trend line converge. That level could be an opportunity to go long.
Currently, this is a no trade zone for me.
SOYBEAN FUTURES (ZS1!)

If Soybeans don’t break to the upside out of that falling wedge and instead breaks down through the current level of support, it could be a long way down before a significant number of buyers are found.
TLT vs SPY
(ISHARES 20+ YEAR TREASURY BOND ETF vs SPDR S&P 500 ETF TRUST

This chart compares TLT vs the SPY.
We initially discussed this chart in the March 29, 2020 Anticipating a Change in Market Direction publication and how it was used to stay out of the S&P 500 as it was setting all-time highs.
INVESTOR CLASS IDEAS
The Investor Class opportunities remain pretty thin as the buyers and sellers fight to gain control of the direction of the market.
There are a number of stocks that are close to ticking all the boxes, however, they need a few more days to set up.
Keep an eye on Gold stocks.
As these ideas set up they will be posted in the Telegram channel.
Here is the link: https://t.me/klarenbachresearch
REMEMBER, CASH IS A POSITION
Don’t FOMO (Fear of Missing Out) into a position. Don’t Chase. Have a plan.
Let’s take a look at an Investor Class Idea carried over from last week.
KROGER CO (KR)
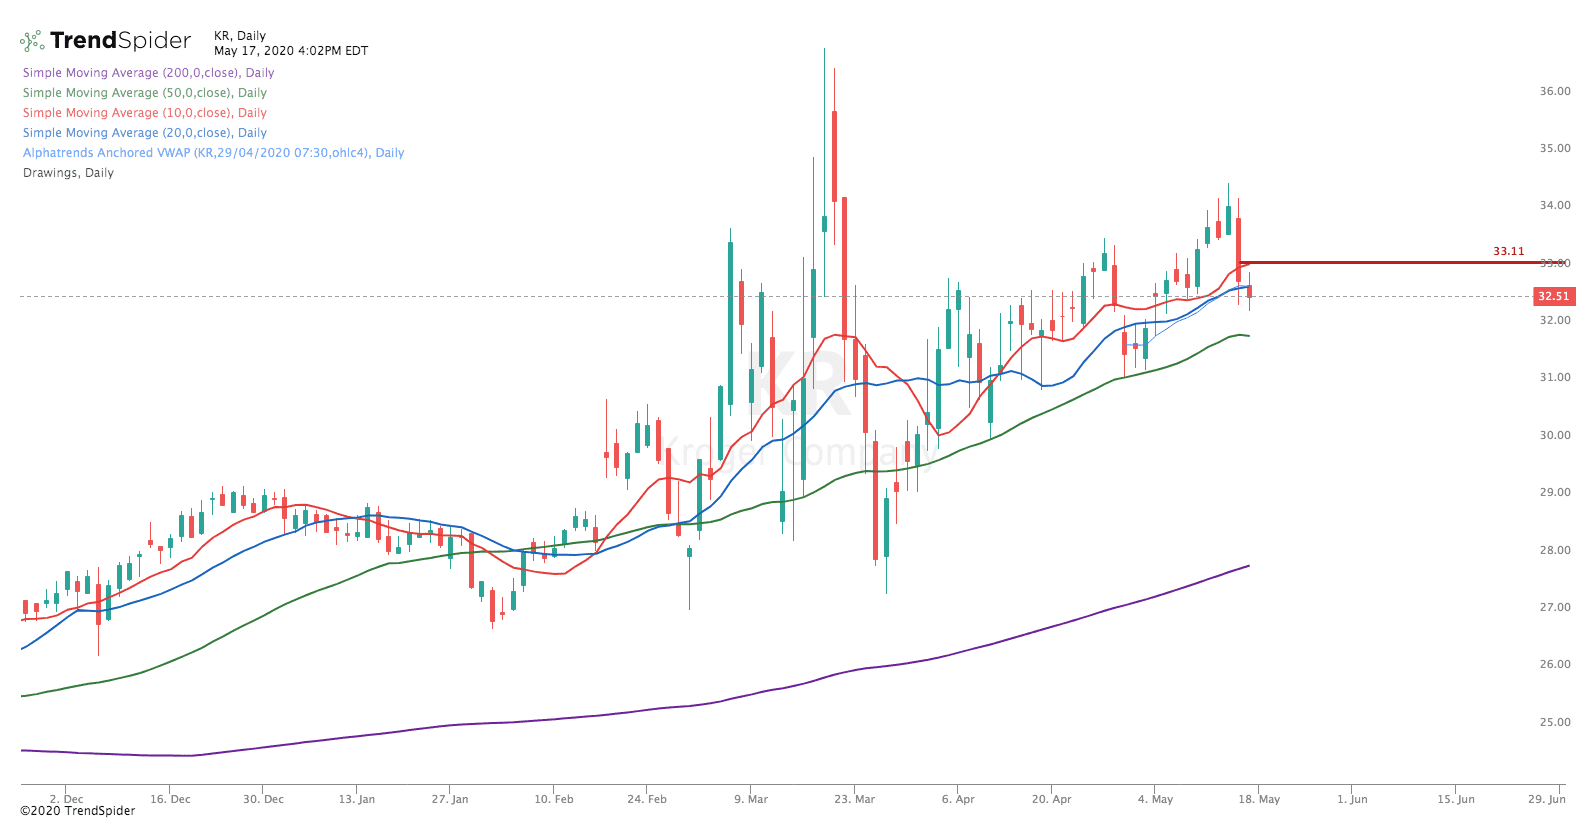
On May 14th, we announced in the Telegram Group, we are raising our stop to breakeven at 33.11. We got stopped out. We have moved on but will keep it on our watchlist.
SWING TRADE IDEAS
There are a number of stocks that are close to ticking all the boxes, however, they need a few more days to set up.
There are number of gold stocks looking good as well as energy. There are a number of energy stocks which will have a flattening 50 DMA in the next week or so.
I have a list of 101 prospects that I will be monitoring and will post in the Telegram Channel as a trade sets up.
Here is the link: https://t.me/klarenbachresearch
APACHE CORP. (APA)
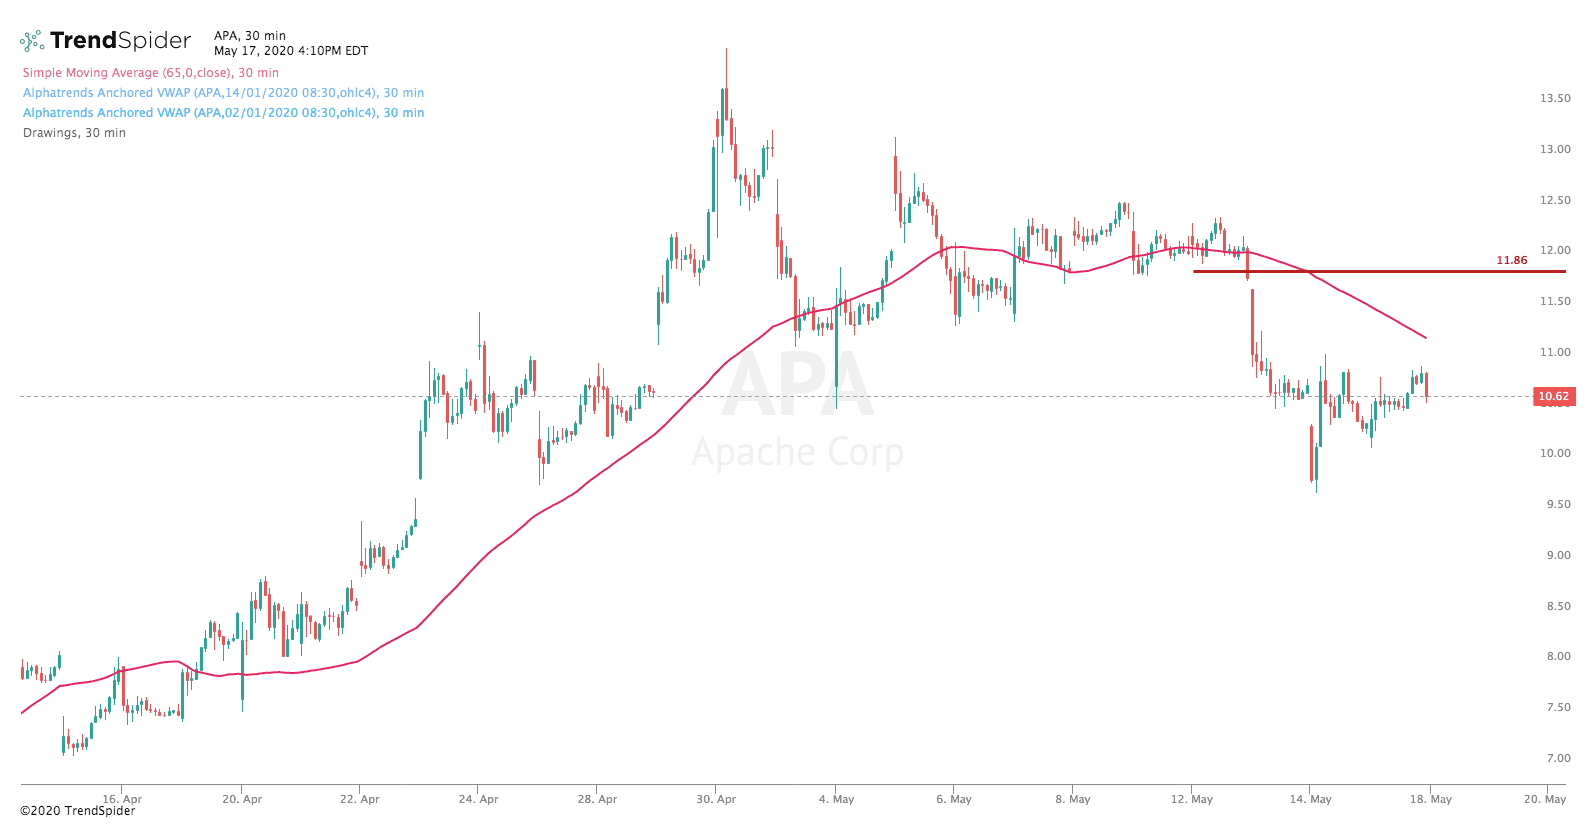
On May 12th, I announced in the Telegram Channel that I closed my APA position at 11.86. The market started dumping in the last hour of the trading day so I made the decision to take the profits.
APA made us over 110% profit.
AURORA CANNABIS (ACB)

ACB is up 15.23% since the idea was published in the April 5 newsletter. It was down 40% at one point.
This could be my Roger Maris asterick trade. It has been managed terribly as I broke two of my rules and actually used it as an example of how not to trade in the Teleram Channel. Search for ACB and look for the Hopium chart. I am embarrassed by it and it might turn out ok……...
CIEN CORP (CIEN)

From last week:
CIEN looks interesting on both the Day and 30 minute charts.
I will be looking for an entry above 48.00 with the initial stop under 45.70.
I will wait 30 minutes after the market opens before entering and will update in the Telegram Group.
We entered on May 11 at 48.02. It pulled back but did not trigger our stop.
Currently, CIEN has 3.42% gains.
ZYNGA INC (ZNGA)

From last week:
I am interested in ZNGA. I am using the 30 minute chart to pick the entry and exit.
Entry: 7.90
Exit: 7.54
I will observe how price behaves in the first 30 minutes and will update in the Telegram Group.
On May 11, I announced in the Telegram Channel that I am placing my order at 7.90. It filled, pulled back but did not trigger the stop.
Currently, ZNGA has 1.77% gains.
That is all for now!
Drop me a line with any questions or comments. You can do that here
I am actively posting charts and ideas on social media.
You can find me here:
Klarenbach Research: klarenbach.ca
Telegram: Klarenbach Research
Twitter: @trentklarenbach
StockTwits: trentklarenbach
Tradingview: trent.klarenbach
I hope that you find the FREE Klarenbach Report worthy of your time and that you choose to hit the subscribe button below.
Please share with anyone else that you think may enjoy it also.
Remember.. It is FREE!
Life is Good
This newsletter is sponsored by Mojocial Media.