


Wheat Trade Idea Follow-up
Trade Ideas for the Active Investor

The November 10th issue of the Klarenbach Report discussed a wheat trade idea with my entry and my initial stop.
Today, I follow up on that idea.
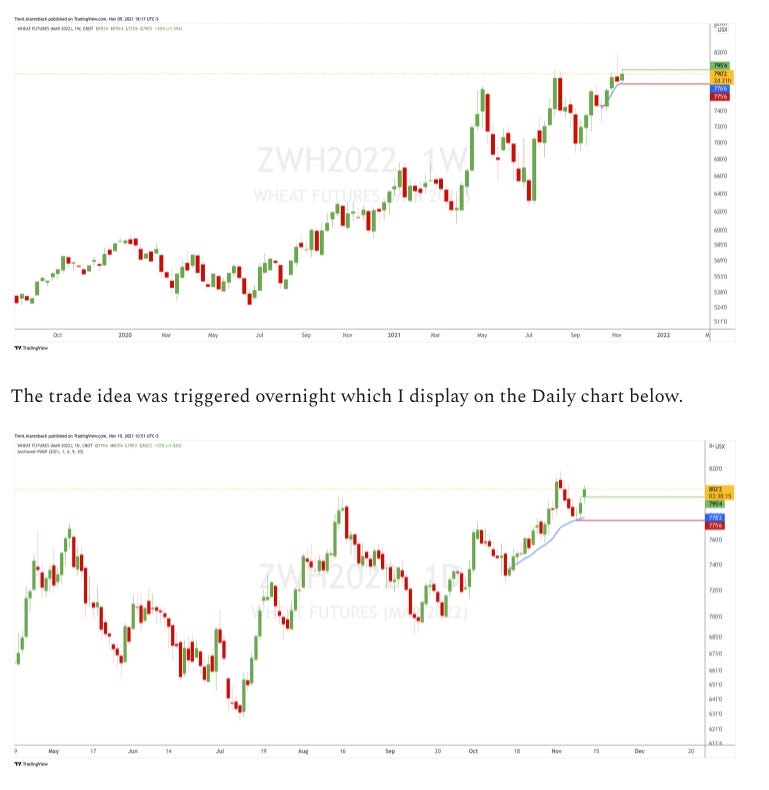
The first image below illustrates the initial trade idea on the weekly chart, with the green line representing the entry and the red line representing the initial stop.
The second image consisting of the daily chart provides notice that the trade triggered and we are in a long position,
As the price advanced, I began raising my stop.
I don’t follow a strict strategy (i.e. % trailing stop) for raising my stop; instead, I rely on my interpretation of the price action and use various charting tools at my disposal.
The following chart demonstrates that the trade is currently showing a 5.5% profit, and our original stop has been moved higher to 814 preventing the trade from turning into a loser.
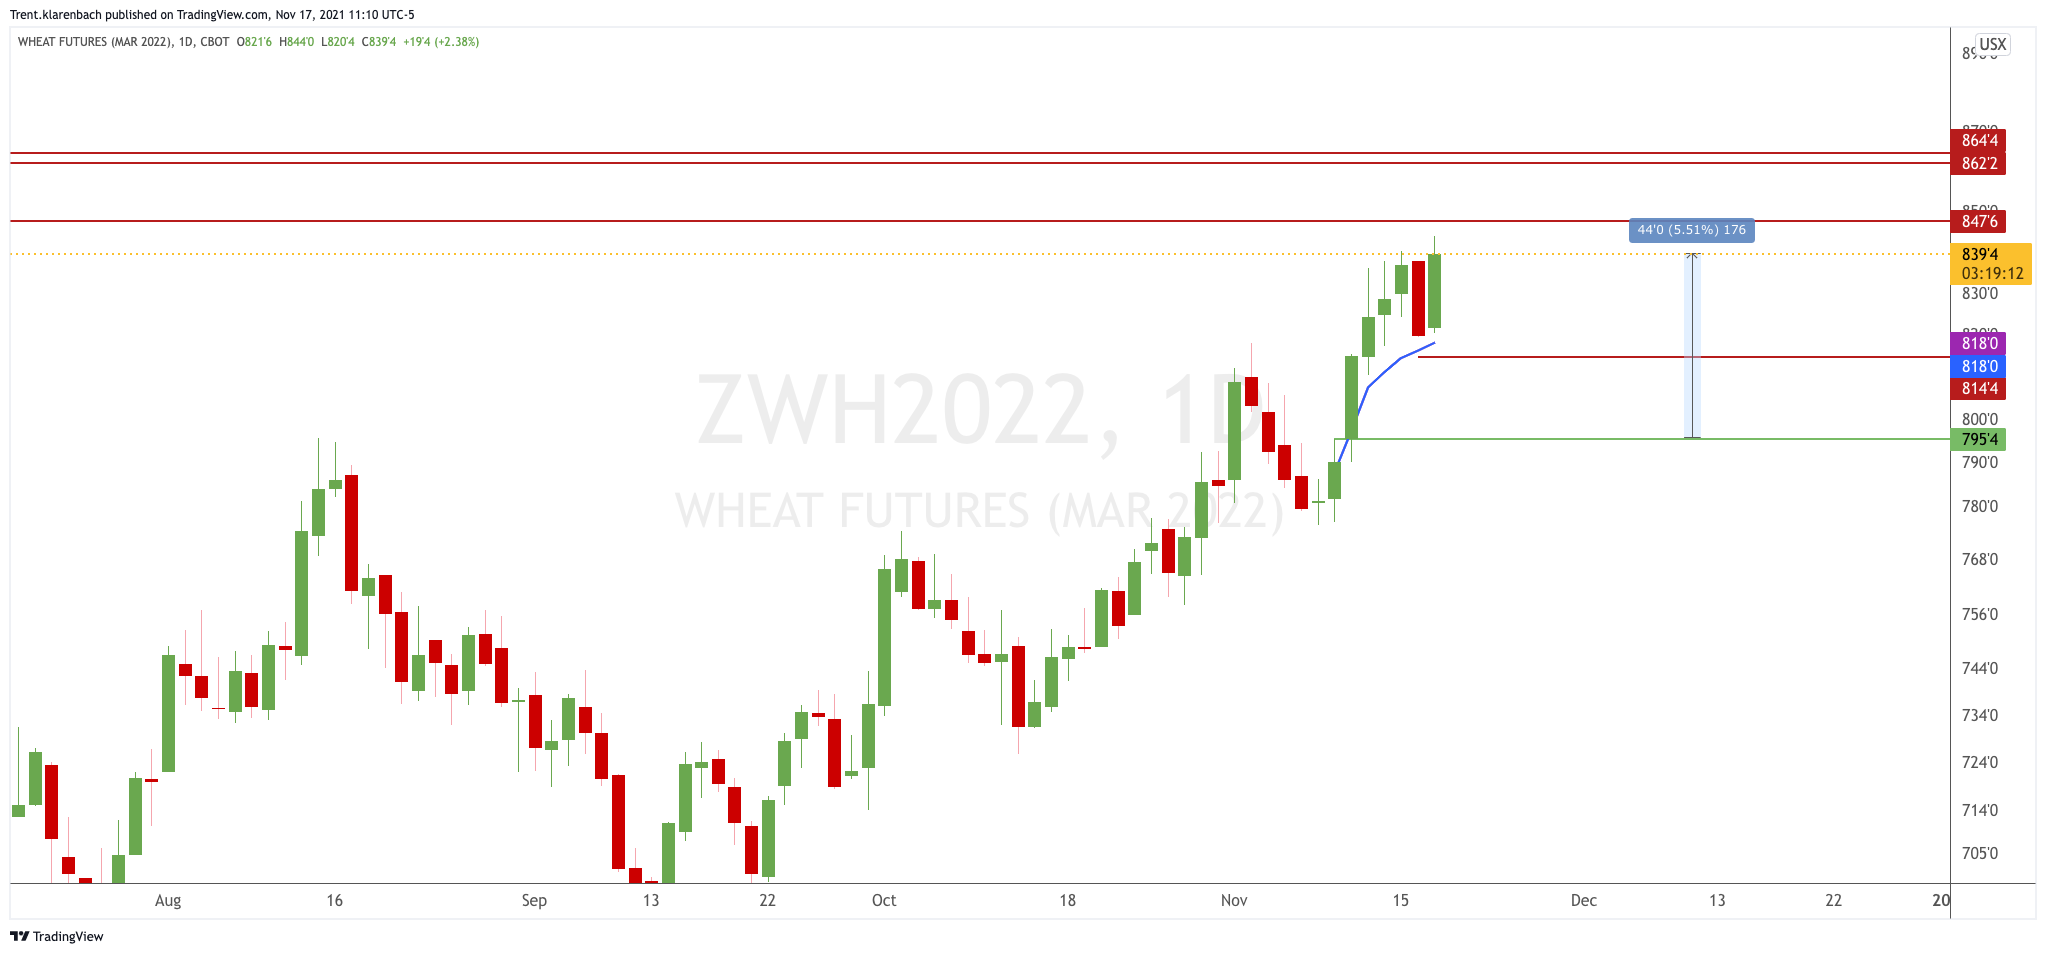
The red horizontal lines represent several levels of interest where I will assess the price action looking for exit opportunities ahead of the stop getting triggered.
I can apply this strategy to all markets, including grains, stock, bonds and cryptocurrencies.