


Where do we go from here?
May 3, 2020 The Klarenbach Report


May 3, 2020
This week is another busy week for companies reporting earnings. I suggest that you become aware of the earnings report date for each of your positions. Quite often, the earnings report is followed by volatility which is impossible to predict.
Capital preservation should be your number one priority and the earnings report is a wildcard that is not worth the risk. I never hold my swing trade positions into earnings and very rarely an investor class position.
I started a free Telegram group, Klarenbach Research, where members can post ideas and ask Technical Analysis related stock market questions.
My midweek trade ideas and commentary will also be posted there as execution is quicker than the newsletter.
I hope this group will create a community to share ideas and expand our knowledge of trading and investing.
Telegram is a messaging app with a focus on speed and security, it’s super-fast, simple and free. You can use Telegram on all your devices at the same time — your messages sync seamlessly across any number of your phones, tablets or computers.
This is the link https://t.me/klarenbachresearch.
It is still pretty young, however, we are adding members who are contributing ideas and questions regarding traditional markets and Bitcoin.
I hope you check it out.
MARKET REVIEW
This week will be busy with earnings reports. Be aware of the earnings report date of your holdings.
On Friday, Amazon closed down 7.6%. Keep an eye on Amazon as where Amazon goes the stock market is sure to go.
Oil stocks made some great gains the past two weeks and could be cooling off.
Glossary
MA Moving Averages are price based, lagging (or reactive) indicators that display the average price of a security over a set period of time.
DMA Day Moving Average, ie. 5 DMA, 10 DMA, 20 DMA, 50 DMA, 200 DMA
WK Week
VWAP Volume-Weighted Average Price is a measure of the average price at which a stock is traded over the trading horizon. If price is above the VWAP, the average purchase is profitable. If the price is below, the average purchase is losing money. It can be a great measure of sentiment.
YTD Year-to-Date
TD TD Sequential Trading strategy is designed specifically to predict potential price exhaustion and likely price reversals. A TD9 count can, but does not always precede a price reversal.
Fib level Fibonacci sequence level. The Golden Ratio of 1.618 and its inverse, 0.618 are found in nature, architecture, fine art and biology. It is fascinating.
Dead Cat Bounce A dead cat bounce is a small, brief recovery in the price of a declining stock or market.
Chart Legend
Day Chart
Red sloping line: 10 DMA
Blue sloping line: 20 DMA
Green sloping line: 50 DMA
Purple sloping line: 200 DMA
Light blue sloping line: YTD VWAP
Weekly Chart
Red sloping line: 30 WK MA
Blue sloping line: 40 WK MA
Green sloping line: 50 WK MA
Purple sloping line: 200 WK MA
Light blue sloping line: YTD VWAP
**Click on any chart to enlarge**
S&P 500 Index (SPX)

On April 5, I posted a daily chart of how I thought price action would play out. You can find it on TradingView here: https://www.tradingview.com/chart/SPX/tFmCL9rR-SPX-Idea/
So far my idea has been pretty accurate.
As expected in previous newsletters, price reached the Golden Pocket area between the .618 and .65 fib retracement levels closing within my green area of interest.
Overhead is the light blue YTD VWAP and the pink VWAP from the December 24, 2019 low. Quite often these VWAPs act as resistance.
We discussed this level of interest here: https://klarenbach.substack.com/p/uncertain-times
I still believe that this is a dead cat bounce and will be looking for confirmation to go to cash or to enter short positions.
At this time, I consider the B Wave from my March 26 tweet near completion and am waiting for confirmation of the C wave formation.

SPY (SPDR S&P 500 ETF TRUST)

The SPY found support at the YTD VWAP with an inverted hammer reversal candle.
The SPY price closed:
Above the declining green 50 DMA (neutral);
Below the declining purple 200 DMA (bearish);
Below the .618 Fib level (neutral);
Above the light blue YTD VWAP (bullish).
Levels of interest are the VWAPs from the YTD and the ATH (all-time high). If price breaks below those, then look out below.
NASDAQ-100 Index (NDX)

NDX retraced, tested and then closed above the .65 fib level showing more strength than the SPX. This is not surprising given the strength of the tech sector. The next fib level of interest in the .786 level.
NDX closed:
Above the Golden Ratio (0.618 fib level) (bullish)
Above the purple 200 DMA (bullish)
Above the declining green 50 DMA (neutral)
Dow Jones Industrial Average (DJIA)

On April 5, I posted a daily chart of how I thought price action would play out. You can find it on TradingView here: https://www.tradingview.com/chart/DJI/2qne4HCp-DJI-IDEA/
The DJIA is weaker than the S&P 500 and the NASDAQ.
Price is above the declining 50 DMA and below the .5 fib level
Until I get new information, I think this is a dead cat bounce with further downside.
TSX Composite Index (TSX)

On April 5, I posted a daily chart of how I thought price action would play out. You can find it on TradingView here:
https://www.tradingview.com/chart/TSX/ZHhZrUpz-TSX-Idea/
Price got above the light blue YTD VWAP for a day and never reached the .618 fib level.
Volume is still declining and I expect the move to be limited.
S&P 500 Volatility Index (VIX)

The S&P 500 goes down, the VIX goes up. The S&P 500 goes up, the VIX goes down.
West Texas Oil (WTIC)

Oil looks like it could tease $18-20 this week.
SPDR Gold Trust (GLD)
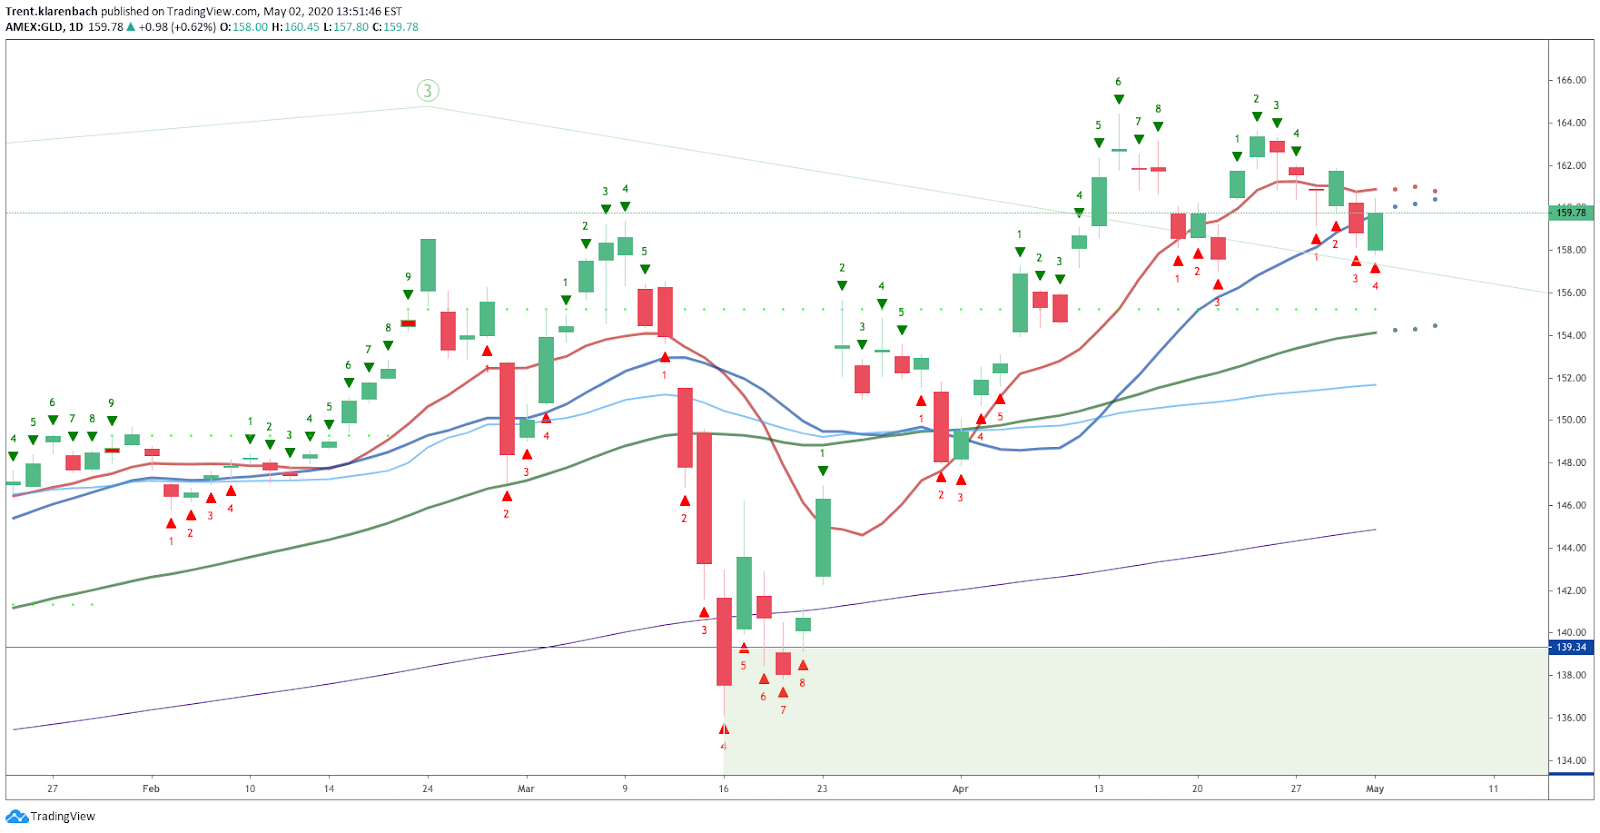
GLD did not break the recent highs and has retraced. I expect further retracement this week. A level of interest for a bounce will be the green 50 DMA.
US Dollar / Canadian Dollar (USDCAD)

Price broke down and found support at the 50 DMA. Price is also above the 10 and 20 DMA and closed on a green TD1 candle.
This is bullish to me..
I am questioning my upper trend lines, however, I will keep the original in place for now. Adjustment may be necessary as more information is available.
BITCOIN (BTC)
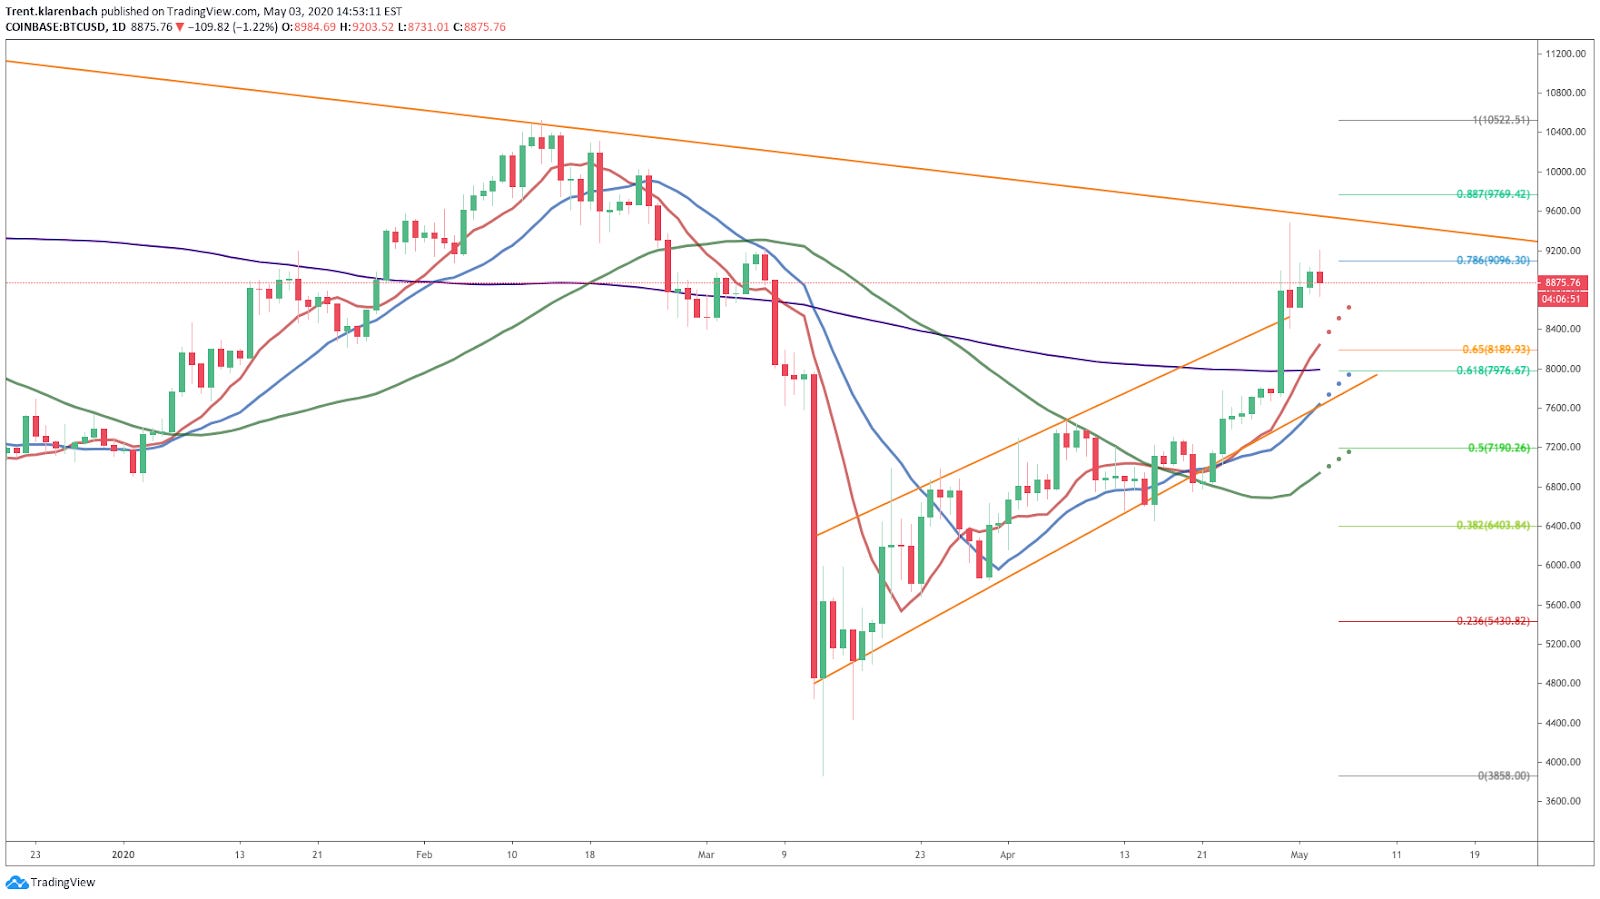
BTC seems to have decoupled from the S&P this week.
Price had a big move to 9478 on Coinbase testing the trend line from the all-time high.
Price is above a flattening 200 DMA. This looks bullish.
I clearly underestimated BTC and did not anticipate a move of this magnitude.
WHEAT FUTURES (ZW1!)

Wheat closed lower again this week.
Price is now below the 50 DMA.
This is a no trade zone for me.
SOYBEAN FUTURES

The price closed higher this week and is still below key moving averages.
I still think Soy is setting up for a nice long position
TLT vs SPY
(ISHARES 20+ YEAR TREASURY BOND ETF vs SPDR S&P 500 ETF TRUST

This chart compares TLT vs the SPY.
We initially discussed this chart in the March 29, 2020 Anticipating a Change in Market Direction publication and how it was used to stay out of the S&P 500 as it was setting all-time highs.
Currently, the market participants are indecisive between TLT and the S&P 500.
If we get a candle close above the green line, TLT will be breaking out against the SPY and we will direct our attention towards Bonds.
If we close below the red line, then the SPY is out performing TLT and we will focus our attention to there.
INVESTOR CLASS IDEAS
Since late January, we have maintained our long-term investment focus on bonds instead of equities.
We discussed how we arrived at that strategy in a March 29th publication found here: https://klarenbach.substack.com/p/anticipating-a-change-in-market-direction
Using a top down approach to scanning the market, I did not identify any sectors and only identified three industry indexes meeting my Investor Class Criteria.
These three industries are: Gold, Grocery Stores and Electronic Gaming.
As you can imagine, the number of opportunities is pretty slim. Mix in earnings this week and the list gets even smaller.
Investing requires patience and a lot of sitting around waiting for a good opportunity.
REMEMBER, CASH IS A POSITION
Let’s take a look at some Investor Class Ideas carried over from last week.
KROGER CO (KR)

KR triggered and pulled back finding support at the 50 DMA.
Our stop is still below 30.01
I will continue to update in my Telegram group.
ISHARES 20+ YEAR TREASURY BOND ETF (TLT)

TLT did not trigger this past week.
I like TLT above 170.93 with a stop at 166.44 after the first 30 minutes of the market open.
Position size accordingly.
I will update in my Telegram group.
SWING TRADE IDEAS
The number of companies reporting earnings this week makes for a short list of Swing Trade candidates.
As I mentioned previously, I do not like to hold a position into earnings.
I have a list of 105 prospects that I will be monitoring and will post in my Telegram group as a trade sets up.
Here is the link: https://t.me/klarenbachresearch
APACHE CORP. (APA)

APA retraced 13.76% on Friday. Ouch
I will be monitoring closely and raising my stops on a lower time frame.
APA is up over 109% since the idea was published in the April 5 newsletter.
AURORA CANNABIS (ACB)

ACB is down 14% since the idea was published in the April 5 newsletter.
This is a great lesson in the importance of position sizing and risk management in counter-trend trades.
This is especially important when trading penny stocks where small moves are large moves.
I am losing patience with this stock and may exit this week.
Hopefully, it will take off this week.
SPDR GOLD TRUST (GLD)

GLD is off the list from last week.
HAIN CELESTIAL GROUP (HAIN)

HAIN stopped out for a 7% loss.
Not all trades are winners.
This is a good example of why we practice risk management and position sizing.
We want to prevent a loser having a significant drawdown on our capital.
With proper position sizing, you can have a success rate of 30% and still be profitable.
From last week:
HAIN looks like it is ready to break out above 28.00. Using the 65-minute chart, I would place the initial stop at 26.10 beneath the green 60- period moving average and the blue VWAP from the swing high.
Position size accordingly.
Please confirm if they report earnings on March 6. I do not recommend holding over earnings.
I will update in my Telegram group.
That is all for now!
Drop me a line with any questions or comments. You can do that here
I am actively posting charts and ideas on social media.
You can find me here:
Klarenbach Research: klarenbach.ca
Telegram: Klarenbach Research
Twitter: @trentklarenbach
StockTwits: trentklarenbach
Tradingview: trent.klarenbach
The Klarenbach Report is sponsored by Mojocial Media Inc.

I hope that you find the FREE Klarenbach Report worthy of your time and that you choose to hit the subscribe button below.
Please share with anyone else that you think may enjoy it also.
Remember.. It is FREE!
Life is Good