
Bitcoin Bearish Scenario
Trade Ideas for the Active Investor


May 16, 2021
Before you, Bitcoin Maximalists go nuts on me, understand that I believe in the Bitcoin principles of sound money and that it has the potential to disrupt the financial system.
Also, realize that this newsletter outlines a potential short-term scenario meant to prepare the reader for bearish price action.
I have recent Bitcoin analysis that can be found using the links below:
UPDATE: Some Alternatives to Bitcoin
I believe that it can be an effective exercise to develop both bullish and bearish scenarios.
Being aware of bullish and bearish scenarios helps me capitalize on both upward and downward trends.
Of course, if you are a strict Trend Follower, you won’t waste your time with this exercise.
This a bearish scenario.
Do I think it will happen?
I think it is a possibility and I hope this exercise prepares me to profit if it does.
For the Bitcoin price chart, I will use the Bitcoin Index as calculated by the TradingView charting platform.
For those new to cryptocurrencies, note that there are multiple exchanges used for price discovery.
The price index that I will use is an aggregation of a number of exchanges to calculate one price.
When applying your technical analysis, be sure to use the exchange that you trade on.
I published my $42,000 target in the April 25 Bitcoin newsletter.
Let us look and see how that is playing out.

As the above chart indicates, buyers have been stepping up at the blue YTD VWAP.
The price wicked below the YTD VWAP today before recovering and is now sitting above that level.
There is a confluence of the purple VWAP from the December 11 low and a 0.618 Fibonacci retracement level, as well as a previous level of resistance in January.
Taking these into consideration, I arrived at my area of interest between 40,600 and 42650.
Looking at the weekly chart, I arrive at a bearish scenario Head & Shoulders Pattern.
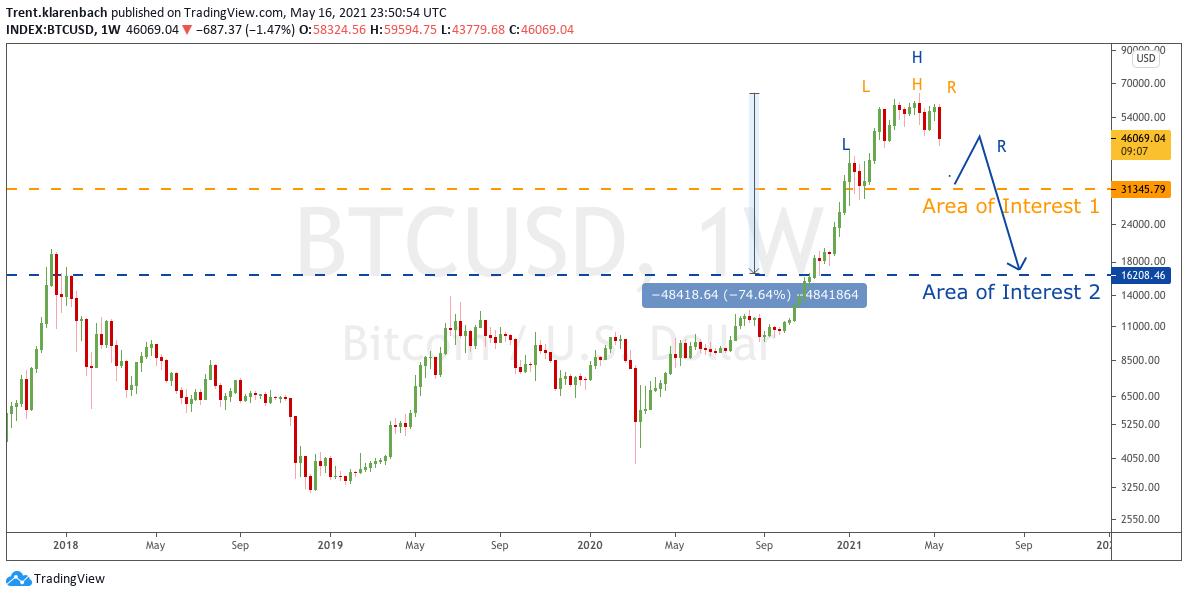
This Russian Doll stacked H&S pattern is premature as neither the yellow nor the blue pattern has completed, however, being aware of the technical possibility is valuable.
This would mean a 74% retracement if the Area of Interest 2 is reached.
Consistent with past BTC corrections.
Not shown on the chart is a 0.5 Fibonacci retracement level in my Area of Interest 1.
The Bitcoin Marketcap chart has a similar pattern to the price chart.
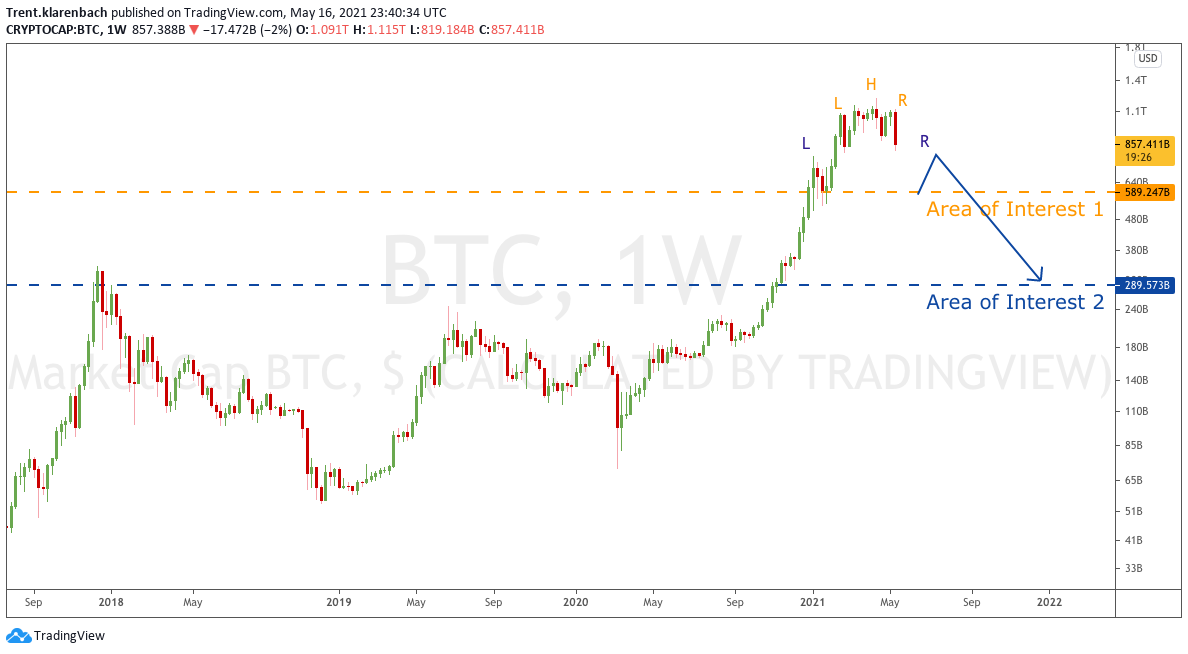
Again, both Head & Shoulders patterns are in the idea stage and neither has completed.
If the Yellow pattern completes, then I will look for the second pattern to complete as well.
The next chart is the Bitcoin Dominance chart displaying Bitcoin’s percentage of the total cryptocurrency market capitalization.

The weekly chart above has the week closing on a Red TD9 count with a long rejection wick. This long wick could be a data error, or not.
A green or red TD9 often acts as a reversal candle as shown in the chart above.
Let us run through the bearish scenario idea:
Bitcoin retracing to the 42k area, 31K and 16K.
The Bitcoin Dominance rises from 40% to a higher level.
If BTC crashes while its Dominance rises, what happens to the altcoins?
They crash further.
Social media is full of Lazer Eyes and Diamond Hands memes.
If this scenario plays out, we will find out how strong convictions are.
I hope that you find this analysis beneficial and share it with others.
Life is Good
I enjoy discussing the markets, whether they are currencies, equities, commodities, or bonds.
Let’s have a conversation, and we can explore a new perspective of the markets that you can apply to your analysis.
If you enjoy this newsletter, please subscribe below:
Please share the Klarenbach Report with those who would benefit from this resource.
Drop me a line with any questions or comments. You can do that here.
I am actively posting charts and ideas on social media.
You can find me here:
Klarenbach Research: klarenbach.ca
Twitter: @trentklarenbach
StockTwits: trentklarenbach
Telegram Channel: Klarenbach Research
Tradingview: trent.klarenbach